
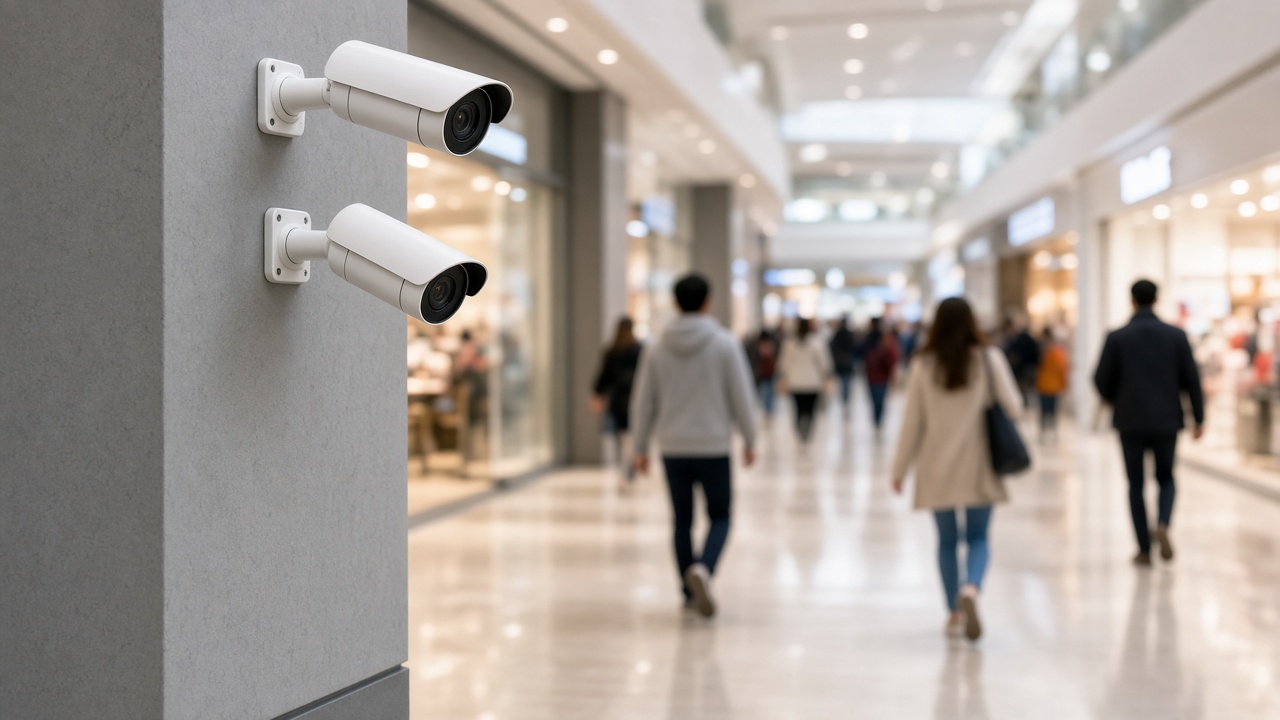
This is Cluster 2 — Types & Examples of Video Analytics. This guide walks through the main categories you will hear about (from basic rules to operational intelligence), then shows everyday and industry examples so you can match a business problem to the right analytics type — including what people mean by “video analytics CCTV.”
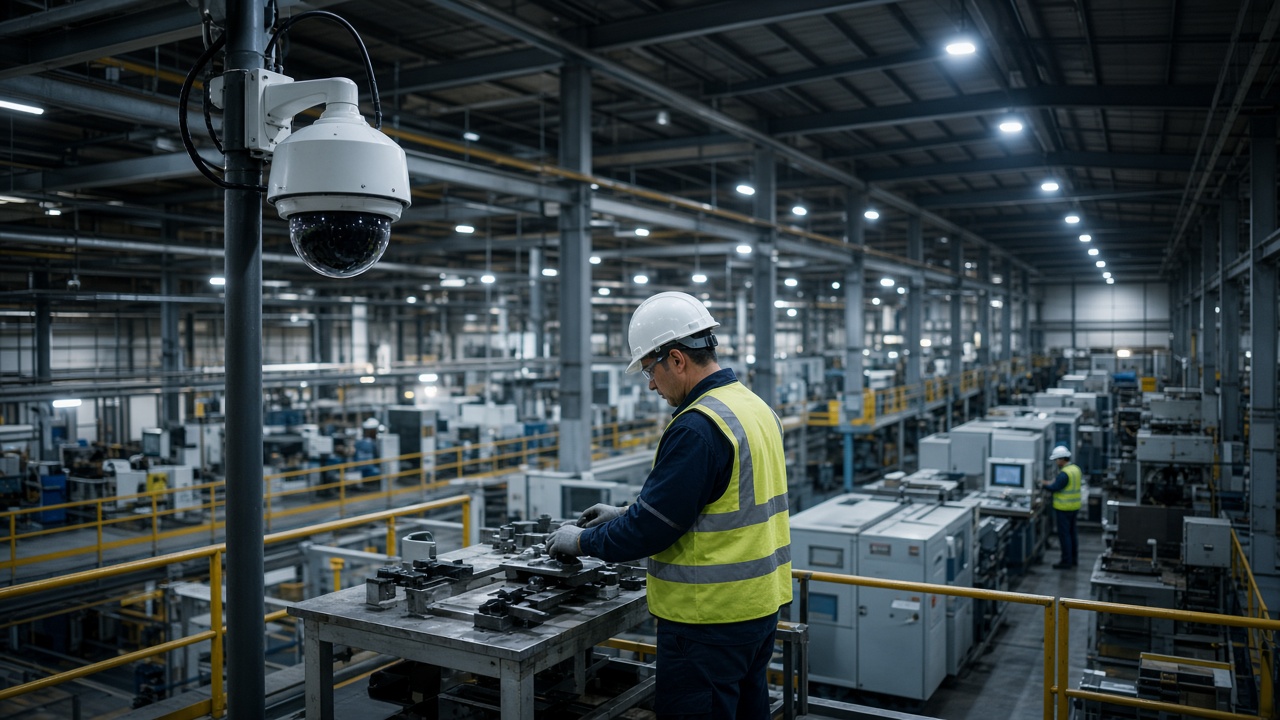
Why types of video analytics matter
Not all “AI CCTV” does the same job. A package aimed at retail queues will not automatically protect a factory perimeter. A traffic ANPR system is not a PPE checker. Grouping analytics into types helps you:
- Write a clear requirement (“we need after-hours intrusion + PPE,” not “we need AI”).
- Compare vendors fairly on the same category.
- Plan cameras and lighting for the hardest use case you actually need.
- Avoid paying for modules you will never operationalise.
Think of types as tool drawers. You open the security drawer, the safety drawer, or the operations drawer depending on the problem.
Basic types (simple rules)
Basic analytics rely on motion and geometry more than deep understanding of objects. They are still useful — especially when budgets are tight or scenes are controlled.
- Motion detection. Raises an alert when enough pixels change. Good for empty rooms after hours; noisy outdoors if leaves and lights move.
- Tripwire / virtual line. An imaginary line in the camera view. Crossing it in a chosen direction creates an event — useful at gates and corridors.
- Intrusion / zone enter-exit. A polygon on the floor plan of the image. Presence inside the zone (sometimes with schedules) triggers alerts.
- Tampering / defocus. Detects when a camera is covered, sprayed, moved, or loses focus — a basic hygiene check for the camera estate.
- Abandoned / removed object (classic). Older algorithms look for objects that appear or disappear and stay that way; modern versions often combine object classification for fewer false alarms.
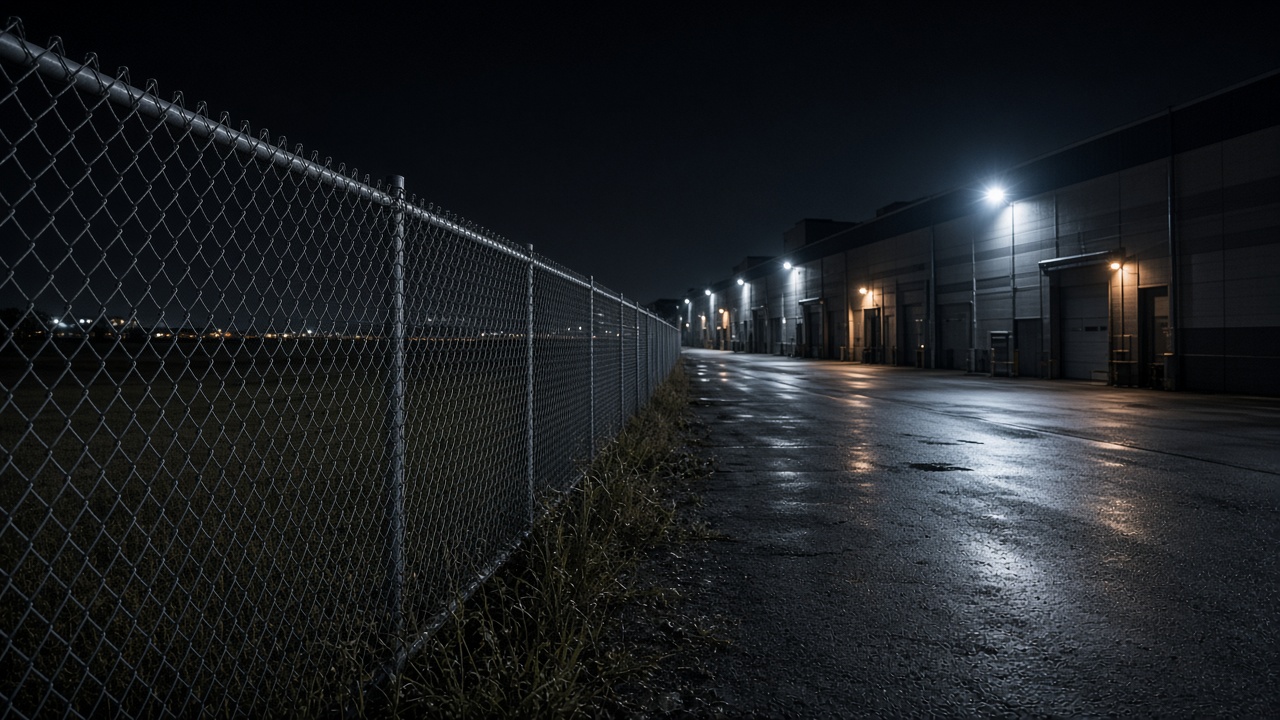
Object types (what is in the video)
Object analytics uses AI models to recognise categories in the frame. This is usually what people mean when they say “AI video analytics.”
- Person detection & counting. Find humans, ignore many non-human motions, count entries through a doorway.
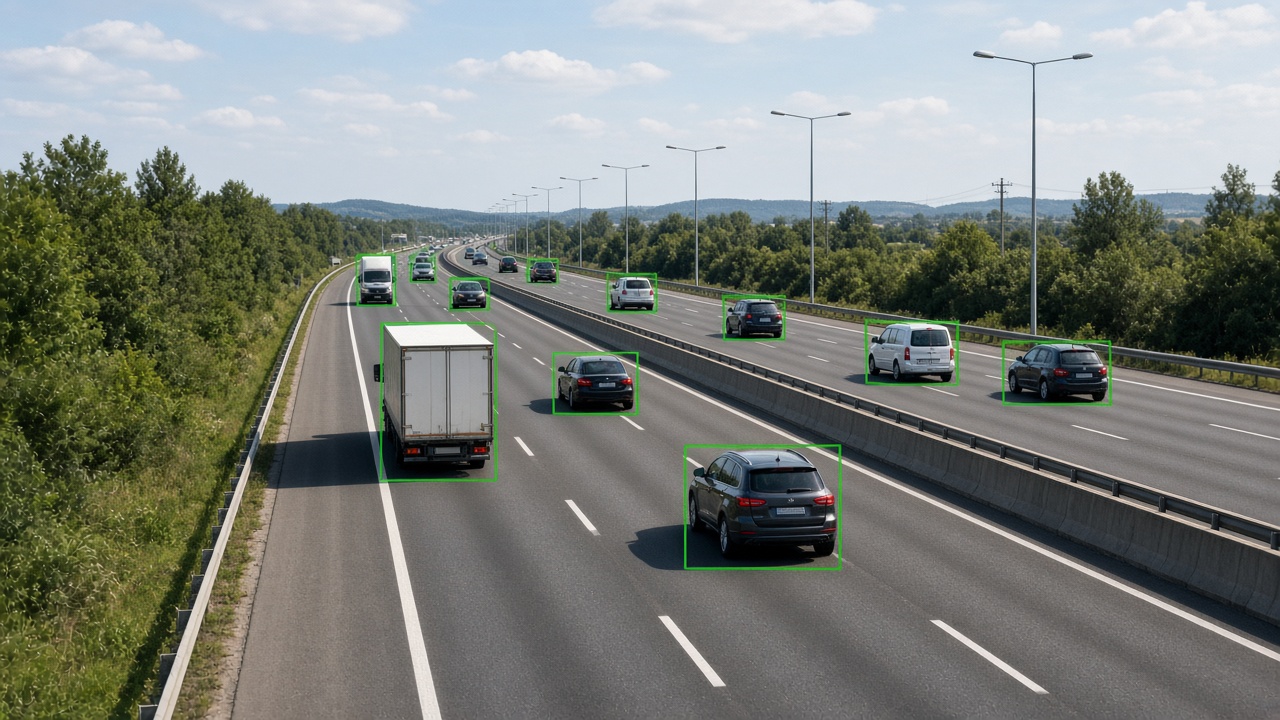
- Vehicle detection & classification. Cars, bikes, trucks, buses — useful for traffic, parking, and yard management.
- PPE / safety gear. Helmets, vests, masks (site-dependent) — a major industrial use case in India and globally.
- ANPR / LPR. Read number plates and create vehicle passage records for gates, highways, and watchlists.
- Attributes (where allowed). Colour of clothing or vehicle, carrying a bag, etc. Treat carefully under privacy policy.
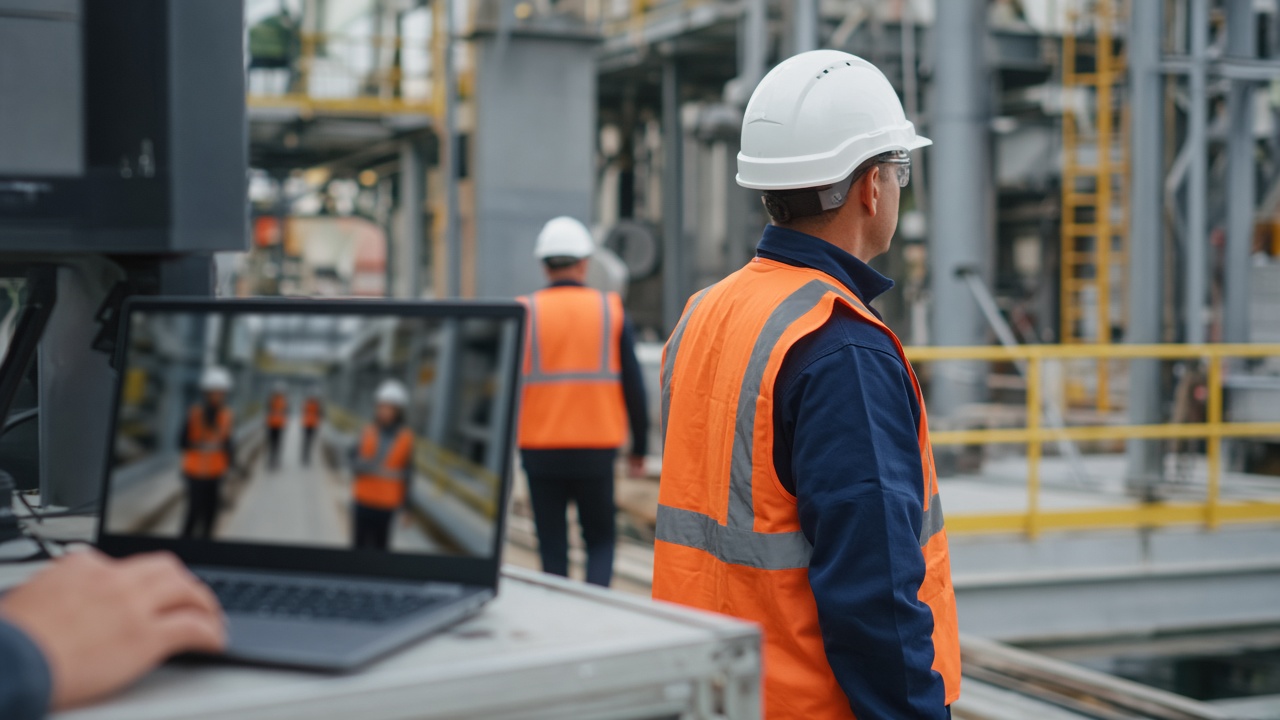
Security analytics types
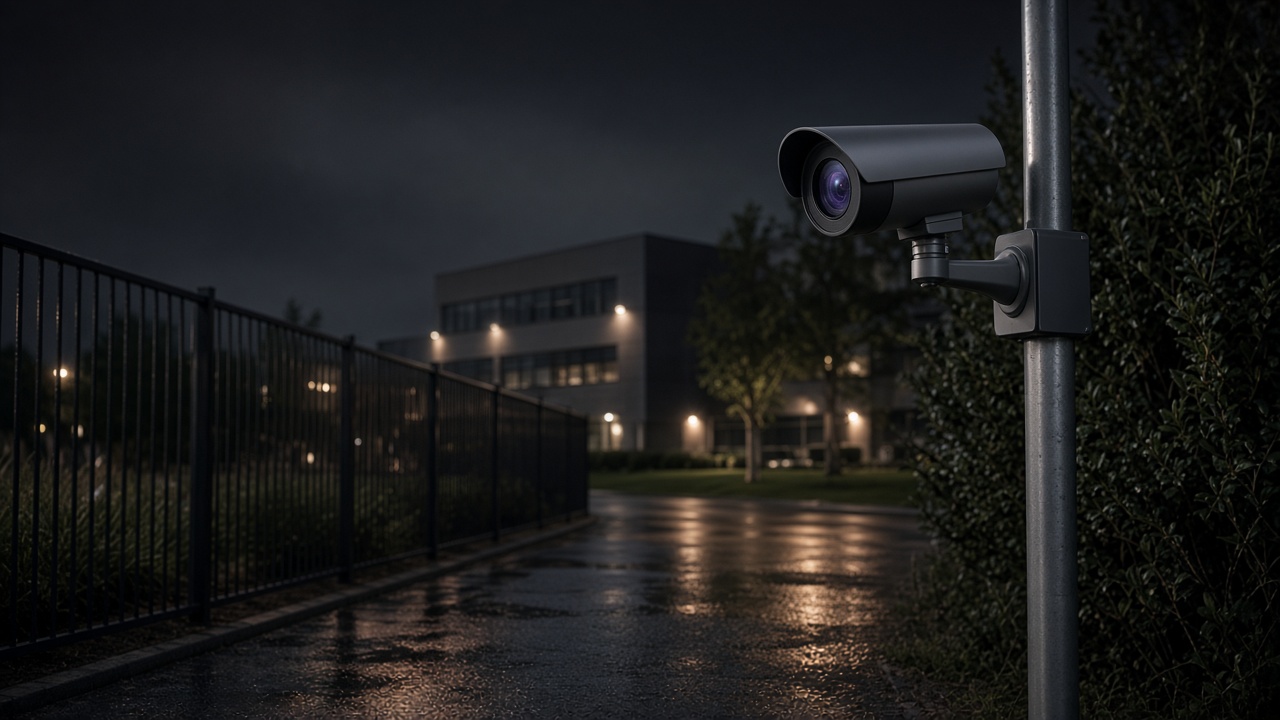
Security analytics focus on protecting people, property, and perimeters. Typical modules include intrusion detection, fence-line monitoring, loitering near ATMs or jewellery counters, tailgating at access doors (sometimes with access-control integration), and watchlist vehicle alerts via ANPR.
Success depends on scene design: clear fence lines, adequate IR or lighting at night, and alert destinations that someone actually monitors. Security analytics without an on-call process simply creates a log nobody reads.
Safety analytics types
Safety analytics support EHS goals. Common detections: missing helmet or vest in marked zones, person in a hazardous area, smoke/fire cues (camera-based, complementary to certified detectors), slip/fall-like events, and interaction risks between pedestrians and forklifts.
These systems work best when zones are painted clearly in the real world and mirrored in software, and when alerts go to supervisors who can coach behaviour — not only punish after the fact.
Advanced AI types (behaviour & identity)
Advanced analytics look at patterns over time or specialised identity tasks:
- Loitering & dwell. Person stays beyond a threshold in a sensitive area.
- Crowd density / unusual gathering. Useful for stations, campuses, and public venues.
- Fight / aggression cues. Higher false-alarm risk; use with human verification.
- Anomaly detection. Learns “normal” motion and flags unusual patterns — powerful but needs careful tuning.
- Face / re-identification (regulated). Only where law and policy allow; many enterprises avoid or limit these.
- Multi-camera tracking. Follow a person or vehicle across several views — complex to deploy well.
Operational analytics types
Operational analytics help run the business, not only protect it:
- Footfall & occupancy for malls, offices, and events.
- Queue length & wait estimation for retail, banks, and ticketing.
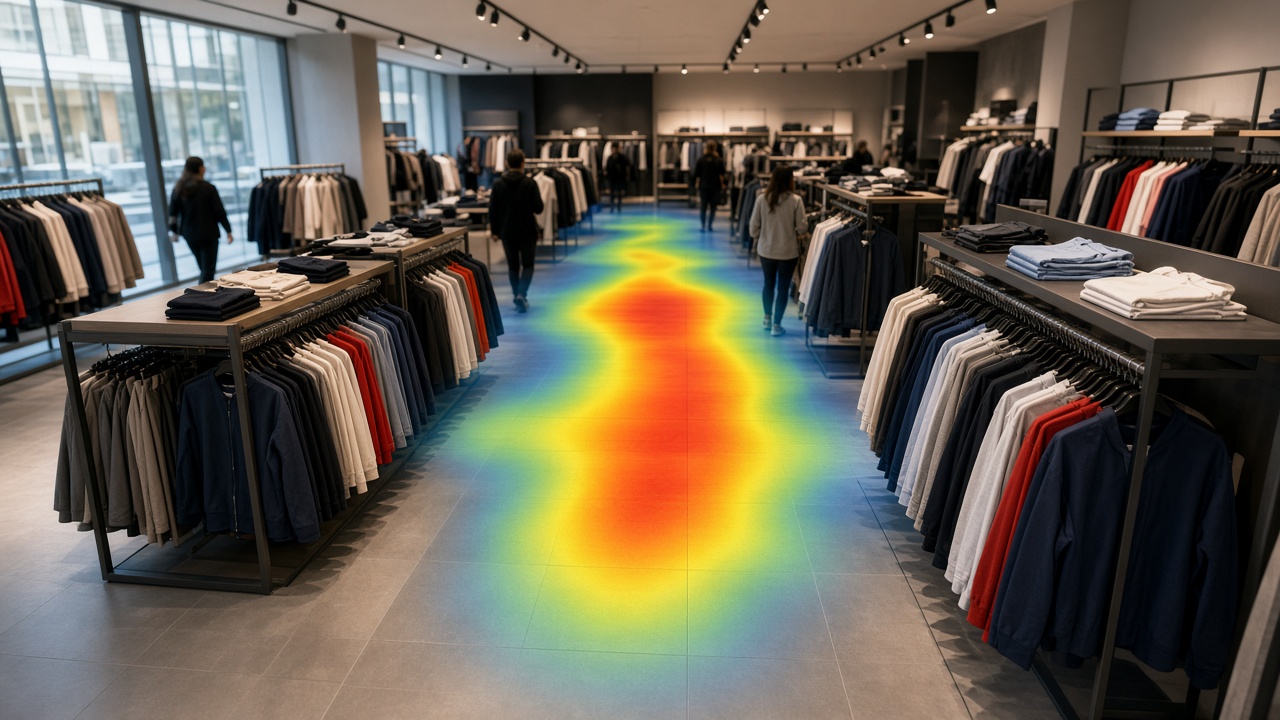
- Heatmaps showing where people spend time.
- Parking occupancy and bay utilisation.
- Process checkpoints — did a vehicle stop at weighbridge / gate as required?
Everyday examples list
Here is a practical list you can map to your site:
- Warehouse fence line: person intrusion after 10 pm.
- Factory shop floor: missing helmet in production bay.
- Hospital corridor: overcrowding near emergency entrance.
- Retail checkout: queue length above threshold.
- Campus gate: unregistered vehicle via ANPR.
- Mall atrium: footfall by hour for staffing.
- Parking basement: occupancy dashboards.
- Highway junction: wrong-way or stop-line related events (project-specific).
- ATM lobby: loitering beyond allowed time.
- Loading dock: truck dwell time and bay misuse.
- School gate: after-hours presence alerts.
- Data centre cage: person in restricted aisle.
Industry examples
- Manufacturing. PPE, restricted zones, forklift lanes, smoke cues near high-risk areas.
- Retail & malls. Footfall, queues, after-hours intrusion, stockroom access patterns.
- Logistics. Yard vehicle tracking, dock occupancy, perimeter security.
- Healthcare. Corridor crowding, restricted pharmacy areas, visitor flow (privacy-sensitive).
- Education campuses. Gate vehicle control, after-hours building alerts.
- Cities & traffic. ANPR, flow monitoring, selected violation support with evidence packages.
- Critical infrastructure. Fence analytics, tamper detection, multi-site central monitoring.
What “video analytics CCTV” means
“Video analytics CCTV” is everyday shorthand for a CCTV system that includes analytics software. It does not name a single product. It means cameras plus intelligent processing that creates alerts, counts, or searchable events.
When you see the phrase in a tender or brochure, translate it into: which types (from this cluster), on how many cameras, with what accuracy expectations, and with which human response workflow.
Choosing a mix of types (not one type forever)
Most real sites need a mix. A logistics park may combine perimeter intrusion (security), PPE in the packing hall (safety), dock dwell timing (operations), and gate ANPR (identity/vehicle). The mistake is buying a “complete AI suite” and enabling every toggle on day one. Enable the smallest mix that covers your top risks, prove it, then add.
A simple planning method: write three columns — Must, Should, Later. Put only life-safety and critical security types in Must. Put efficiency types in Should. Put experimental or high-false-alarm-risk types in Later. Review the list with operations, security, and IT together so nobody is surprised.
Scene design tips for each family
- For basic tripwires: draw lines where people or vehicles naturally cross, not across busy background motion. Avoid lines that trees or flags will cross in wind.
- For person detection: mount so a full body or at least torso is visible. Extreme top-down views and extreme distant views reduce reliability.
- For PPE: place cameras where workers face roughly toward the lens at entry to the zone. Side or back-only views miss helmets more often.
- For ANPR: control distance, angle, shutter, and IR carefully. Plate analytics fail for optical reasons more often than model reasons.
- For queues: look along the queue, not only from far away. Counting corridors near entry gates works better than wide atrium shots alone.
- For heatmaps: use consistent camera positions over time; moving the camera invalidates historical comparison.
Three worked example walkthroughs
- Example A — Factory PPE. Goal: reduce missing helmets in a marked production bay. Type family: safety object analytics. Cameras: two views at bay entry and main aisle. Rules: person detected in bay polygon without helmet class during shift hours. Alert: push to shift supervisor app with snapshot. Metric: weekly PPE non-compliance events trending down, plus supervisor acknowledgement rate above 90%.
- Example B — Retail queues. Goal: open an extra till when wait risk rises. Type family: operational queue analytics. Cameras: overhead or angled views of checkout lanes. Rules: queue length or estimated wait above threshold for N seconds. Alert: floor manager watch and public-address optional. Metric: average peak wait reduction and fewer customer complaints logged.
- Example C — Campus gate vehicles. Goal: know which vehicles entered after hours. Type family: ANPR identity/vehicle. Cameras: lane-aligned ANPR camera plus overview camera. Rules: plate read stored for all passages; watchlist hits alert security immediately. Metric: read-rate on sample set, and time-to-acknowledge for watchlist hits.
RFP language that keeps types honest
When writing tenders, avoid “provide AI video analytics” as a single line. Instead specify: event types, expected environments (indoor/outdoor/night), minimum evidence package (snapshot + clip seconds), reporting needs, and acceptance tests using recorded sample videos from your site. Ask bidders to map each claimed feature to one of the type families in this cluster. That mapping exposes vapour features quickly.
Also require a false-alarm handling plan: who tunes, how often, and what “acceptable noise” means during the first month. Types are only valuable when the operating noise stays manageable.
Layman glossary for types
Tripwire: an imaginary line; crossing it creates an event.
Polygon zone: a drawn shape; presence or behaviour inside it matters.
Object class: the label AI assigns, such as person, car, or helmet.
Tracking: following the same object across many frames.
Heatmap: a visualisation of where motion or people concentrate over time.
ANPR / LPR: reading vehicle registration plates from video.
Watchlist: a list of plates or other identifiers that should alert immediately when seen.
False alarms by type — what usually goes wrong
Every analytics type fails in characteristic ways. Knowing the failure mode helps you design scenes and rules before go-live.
Motion and tripwires fail on wind, insects, headlights, and rain streaks. Mitigate with object filters (person/vehicle only), schedules, and avoiding sky or tree-heavy lines.
Person detection fails on tiny distant figures, heavy occlusion, unusual clothing silhouettes, and reflective floors. Mitigate with better mounting height and minimum object size thresholds.
PPE detection fails when workers face away, wear non-standard colours, or stand partially outside the zone. Mitigate with entry-chokepoint cameras and clear painted zones in the real world.
ANPR fails on motion blur, extreme angles, dirty plates, non-standard fonts, and mismatched IR. Mitigate with dedicated lane cameras and shutter/IR tuning — not by “turning AI up.”
Queue analytics fail when staff walk through lanes, carts look like people, or camera views cut the queue. Mitigate with lane-aligned views and staff exclusion zones if the software supports them.
Behaviour / anomaly types fail when “normal” changes seasonally (festivals, shift patterns). Mitigate with longer baselines and human review before automated escalation.
How types combine in one camera view
One camera can host multiple types if the view supports them. A loading-bay camera might run vehicle presence (ops), person-in-forklift-lane (safety), and after-hours intrusion (security) on different schedules. Do not overload a single poor view with every module — accuracy collapses when the camera cannot see any job well.
When combining types, assign severities carefully. A queue alert should not page the same night phone as a perimeter breach. Mixed types without severity design create alert fatigue faster than any single noisy rule.
Buyer scorecard for types & examples
Score each proposed type from 1–5 on: business impact, scene readiness, false-alarm risk, staffing readiness, and integration need. Multiply impact × readiness and divide by false-alarm risk as a rough priority index. Types that score high on impact but low on readiness belong in a camera-upgrade workstream first — not in a software blame cycle.
Bring two or three real video clips to every demo and insist the type is shown on those clips. Examples on brochure footage teach almost nothing about your night shift.
Training operators on types (without drowning them)
Operators do not need a computer-vision lecture. They need to recognise the event names they will see, know which ones are urgent, and know how to mark true versus false. Build a one-hour training that shows five real clips per enabled type from your own cameras. Pause after each clip and ask: what should you do in the first minute?
Print a pocket card: event name, severity colour, first action, escalate-to contact. Laminate it for guard rooms. Update the card whenever the event dictionary changes. Types that never appear on the card effectively do not exist operationally — even if the licence is paid.
Refresh training every quarter with new false-alarm examples. Celebrate operators who label noise carefully; that labelling is how the programme improves. Punishing people for “too many false alarms” without giving them a way to report bad zones creates silence, not accuracy.
For multi-site companies, record a short internal video walkthrough of the console once, then localise only the site-specific zone examples. That keeps training consistent while respecting local camera layouts.
Maintenance calendar tied to analytics types
Different types need different physical maintenance. ANPR lanes need clean lenses and checked IR more often than indoor footfall cameras. Outdoor perimeter tripwires need foliage trimming on a seasonal calendar. PPE entry cameras need lighting checks when factory layouts change.
Put analytics maintenance on the same board as fire extinguisher checks — not as an afterthought IT ticket. When a type’s true-positive rate drops suddenly, assume a physical cause first (dirt, aim shift, new obstacle) before blaming the model.
Keep a simple log: date, camera, type affected, physical fix or software tune, and result. Over a year that log becomes your best internal playbook — better than any generic brochure.
Summary
- Choose types from a clear problem statement.
- Start with one family — security, safety, or operations — prove value on a handful of cameras, then expand.
- Cluster 3 covers the software and tools that implement these types; Cluster 4 covers AI cameras and apps; Cluster 5 covers full AI surveillance projects.