AI, Data & Digital Intelligence · Data & Operational Intelligence

Data & Operational Intelligence: Give Decision-Makers a Clearer View of Operations

MLT brings relevant information together into dashboards, analytics and operational intelligence systems, where data becomes useful to the people running the organization.

Solution Data Integration · Analytics · Operational Dashboards 5 min read
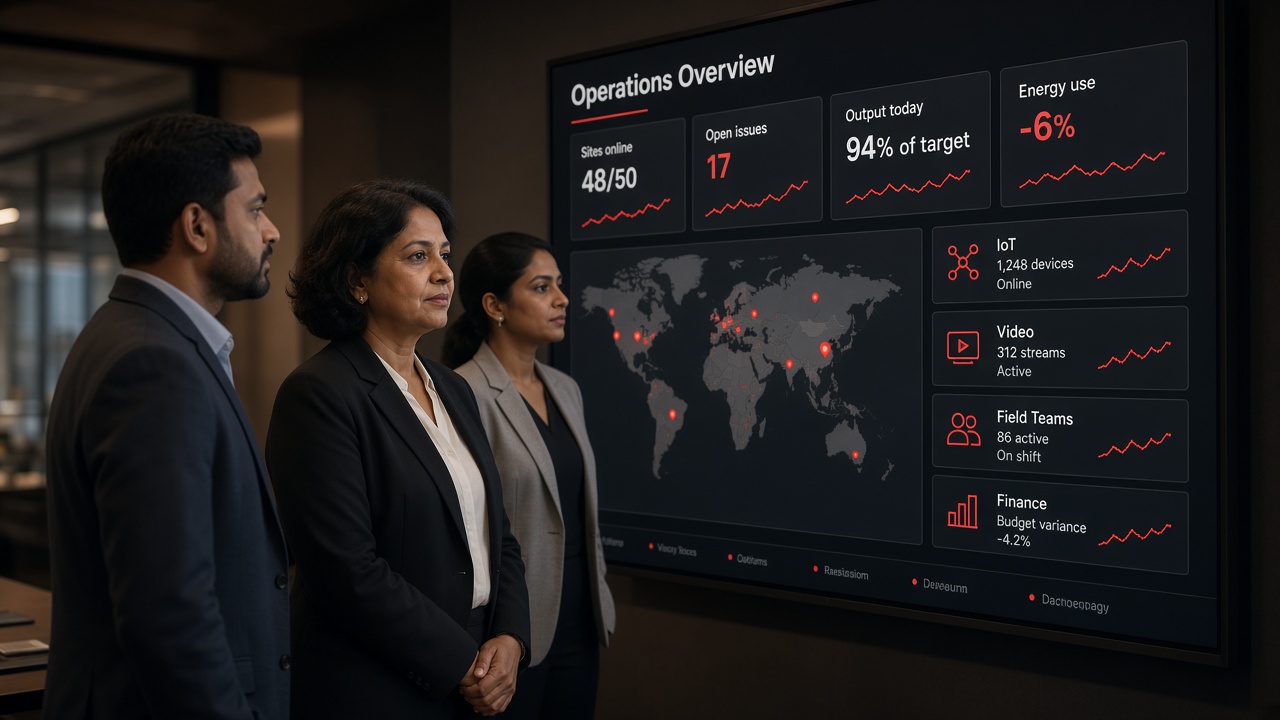
Senior executive and two colleagues in a briefing room viewing an operations overview dashboard with sites online, open issues, output against target, energy use, a site map and IoT, video, field team and finance panels

Give Decision-Makers a Clearer View of Operations

Organizations often have information distributed across many systems, each holding part of the picture.

MLT can bring relevant information together into dashboards, analytics and operational intelligence systems.

Data & Operational Intelligence at a glance
SolutionData & Operational Intelligence
Solution AreaAI, Data & Digital Intelligence
Data SourcesBusiness Apps · Databases · IoT · Video · Mobile · Spreadsheets · APIs · Operational Systems
DeliversDashboards · Analytics · Operational Intelligence Systems
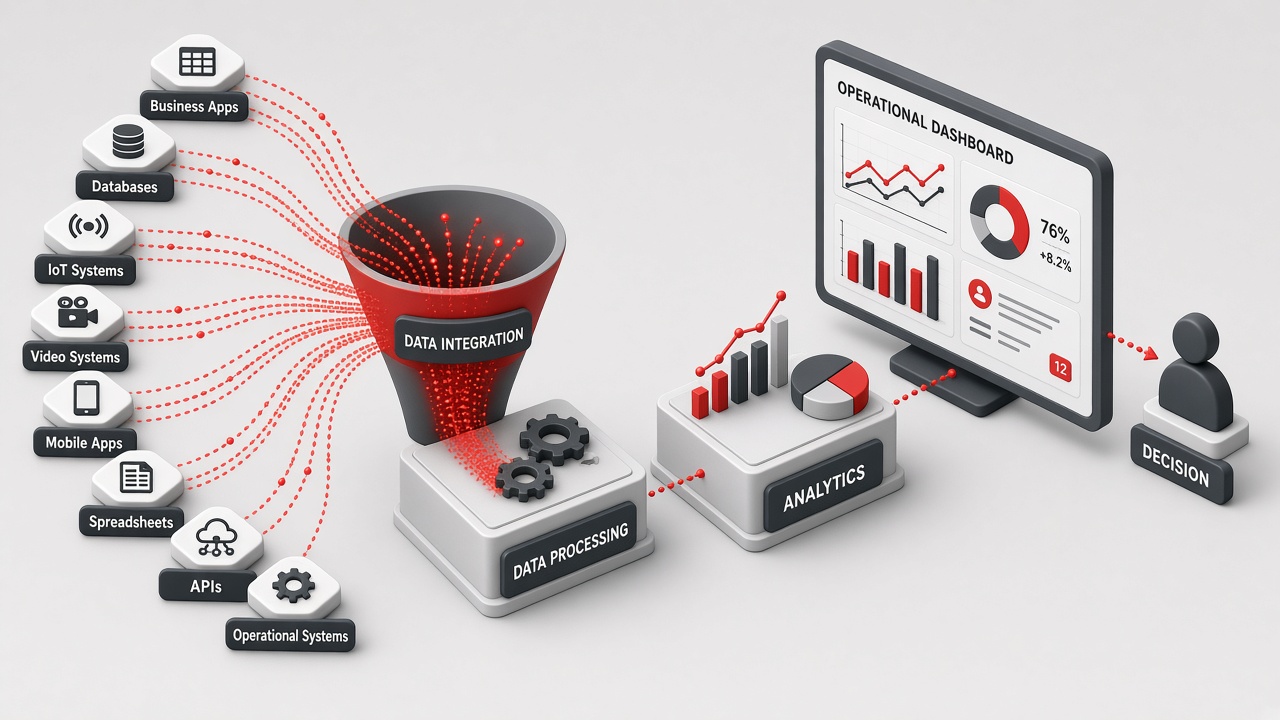
FlowData Sources → Integration → Processing → Analytics → Dashboard → Decision
ForThe People Running the Organization
Solution highlights
0
Types of data sources brought together
0
Stages from data to decision
One View
For decision-makers

Information Distributed Across Systems

Organizations often have information distributed across:

Common data sources
Business ApplicationsERP, CRM & line-of-business apps
DatabasesRecords & transactions
IoT SystemsSensor & device readings
Video SystemsCameras & AI events
Mobile ApplicationsField & customer apps
SpreadsheetsTrackers & manual reports
APIsExternal & partner data
Operational SystemsPlant, site & control systems
Over-the-shoulder view of an analyst working late, writing a weekly operations report by hand from a laptop spreadsheet and database query, a mobile app admin panel on a tablet and piles of printed reports, with sticky notes for ERP export, sensor CSV, camera logs, field app and API data
Without operational intelligence: a weekly report compiled by hand from many separate sources

From Data Sources to Decisions

How data becomes a decision
Multiple Data SourcesApplications, devices, systems and files
Data IntegrationConnecting and collecting the relevant data
Data ProcessingCleaning, combining and structuring
AnalyticsTrends, comparisons and insights
Operational DashboardOne clear view of operations
DecisionInformed action by the people in charge
Isometric illustration of business apps, databases, IoT systems, video systems, mobile apps, spreadsheets, APIs and operational systems streaming data into a data integration funnel, through data processing and analytics to an operational dashboard and a decision
Eight kinds of sources, one flow: integration, processing, analytics, dashboard and decision

Data Integration & Processing

Data from each source is collected, cleaned and combined so that figures from different systems can be trusted and compared side by side.
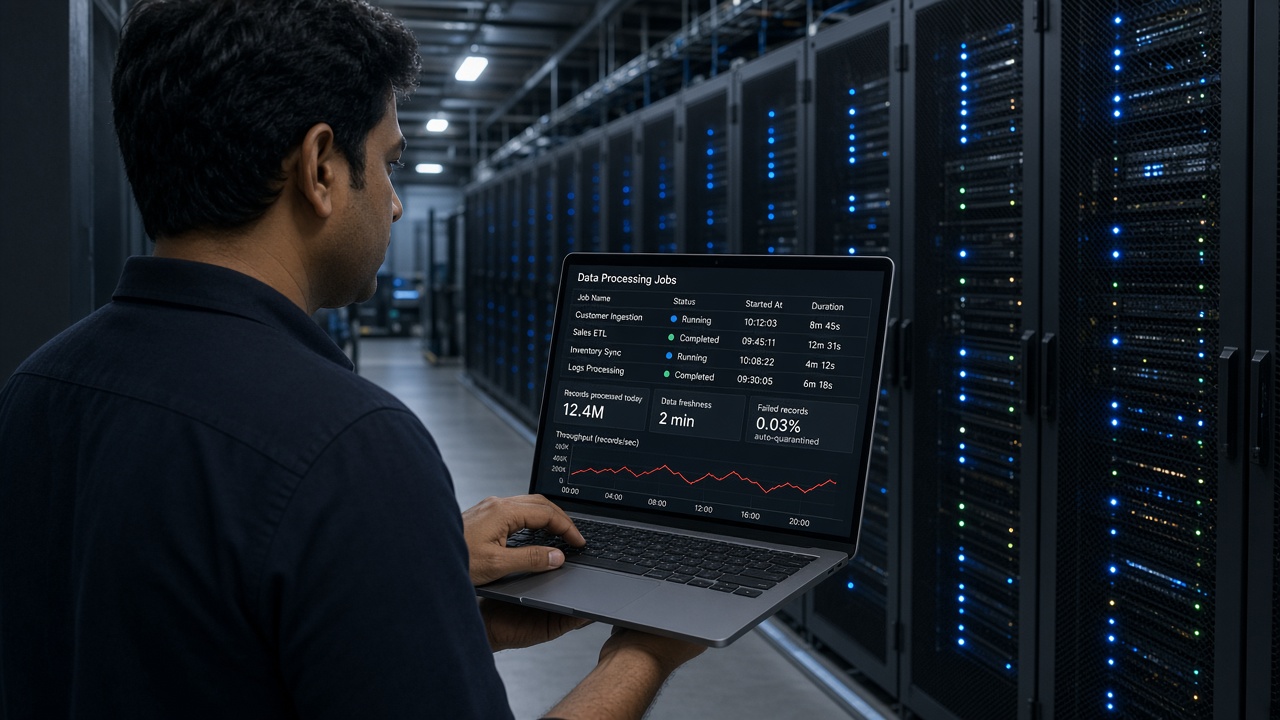
Over-the-shoulder view of a data engineer in a server room aisle holding a laptop showing data processing jobs, records processed today, data freshness of two minutes, a small percentage of failed records auto-quarantined and a throughput chart
Data processing: jobs, freshness and data quality monitored behind the dashboard

Analytics

Analytics connects data that used to sit apart, for example relating IoT sensor readings to production output, and lets teams drill down by site, shift or line.
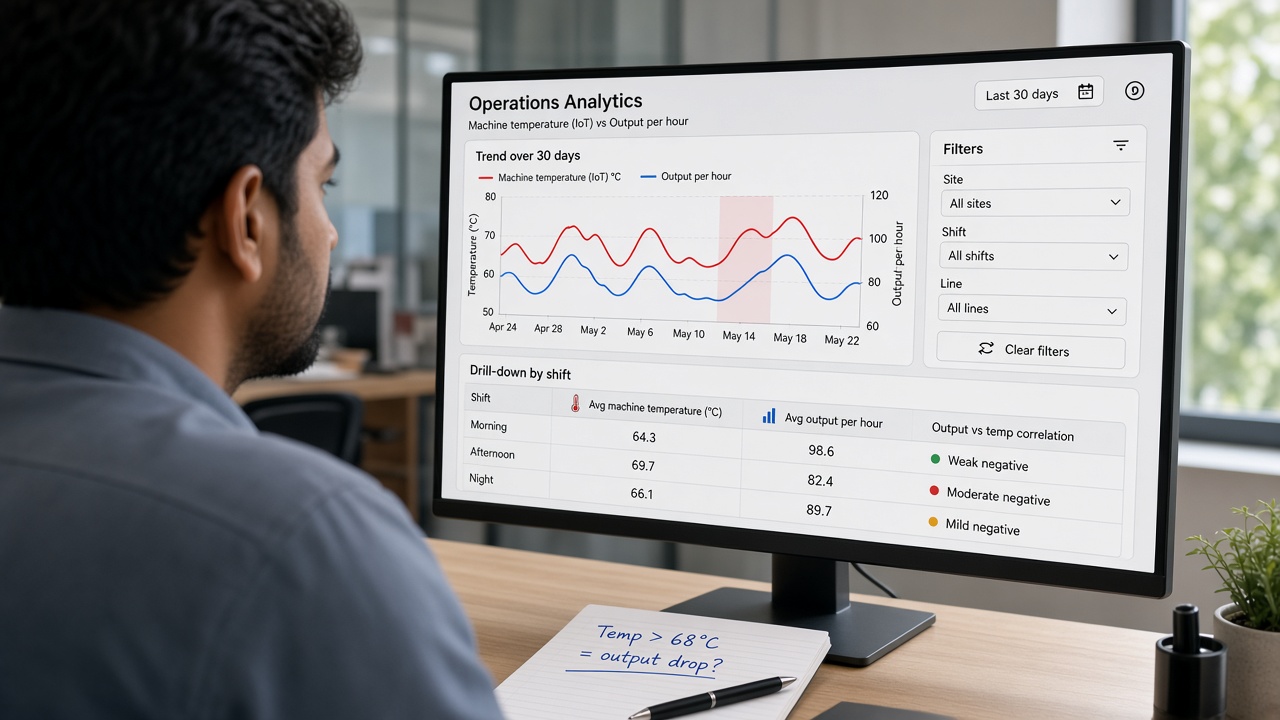
Operations analyst viewing a chart of machine temperature from IoT sensors against output per hour over 30 days, with site, shift and line filters, a drill-down table by shift and a handwritten note asking whether high temperature causes an output drop
Analytics: combining IoT and production data to explain a drop in output

Operational Dashboard

An operational dashboard gives teams one live view of what is happening: status, exceptions and performance, drawn from every relevant system.
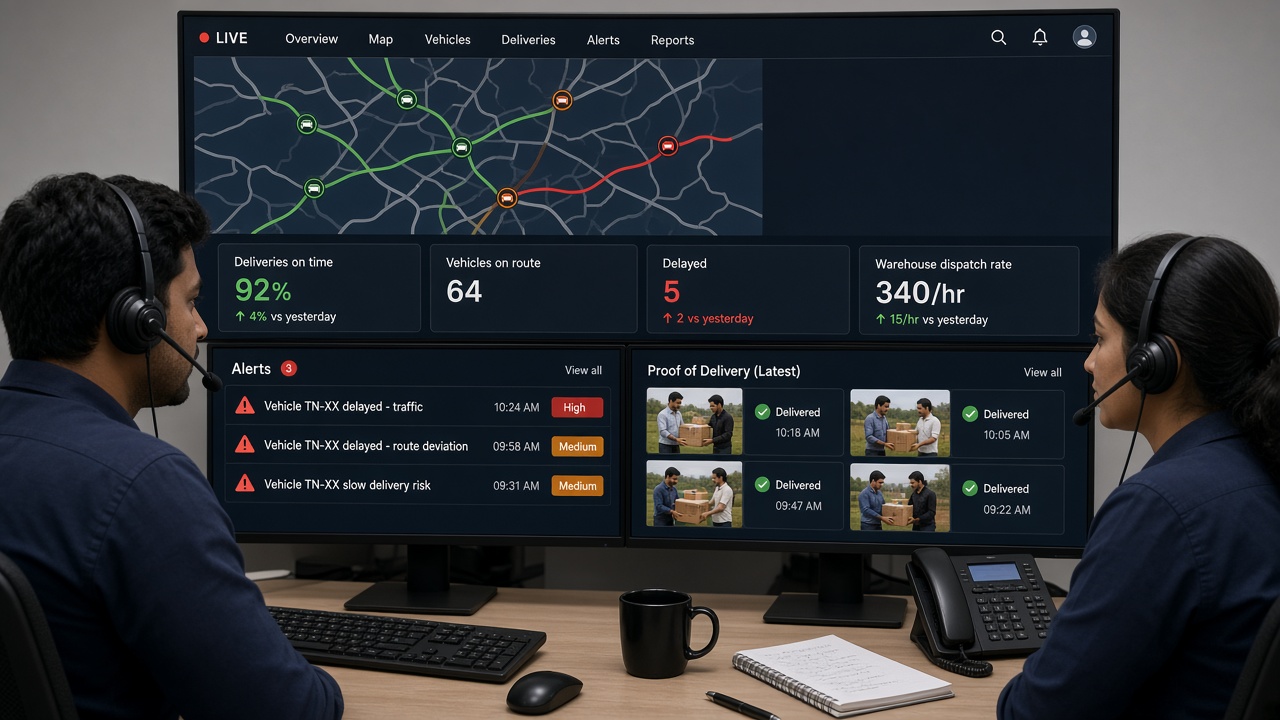
Two logistics dispatchers with headsets facing a live operational dashboard with a route map of vehicles, deliveries on time, vehicles on route, delayed deliveries, warehouse dispatch rate, alerts and proof-of-delivery photos from the field
Operational dashboard: vehicles, deliveries, alerts and field updates in one live view

Where Data Becomes Useful

This is where data becomes useful to the people running the organization. Reviews and decisions are based on current, combined information rather than separate reports.

Municipal review meeting where officials around a conference table look at a ward performance review dashboard with a ward-wise map, water supply complaints, garbage collection coverage, streetlights not working and a ward flagged as action required
Decision: a review meeting driven by a live ward-level performance dashboard
Distributed information
  1. Each system holds part of the picture
  2. Reports compiled manually and late
  3. Decisions based on partial or outdated data
Operational intelligence
  1. Relevant data brought together in one place
  2. Dashboards and analytics updated automatically
  3. Decisions based on a clearer, current view

Explore All AI, Data & Digital Intelligence →

A Clearer View for Better Decisions

By bringing together business applications, databases, IoT, video, mobile, spreadsheets, APIs and operational systems, MLT gives decision-makers dashboards and analytics they can act on.

Is your information spread across systems?

Tell us where your data lives and what decisions you need to make, and our team will help design the right dashboards and operational intelligence system.

Back to AI, Data & Digital Intelligence
Get in touch

Need a clearer view of your operations?

Share where your data lives and what decisions you need to make, and our team will help design the right dashboards and operational intelligence system.

No pitch decks. Just a hello — we’ll take it from there.