IoT & Smart Infrastructure · IoT Solutions

IoT Solutions: Connect Sensors, Devices and Physical Assets to a Centralized Digital Platform

Sensor integration, real-time monitoring, alerts, device health and multi-location visibility, powered by iSenzoT.

Solution Sensors · Real-Time Data · Dashboards · Alerts · APIs 5 min read
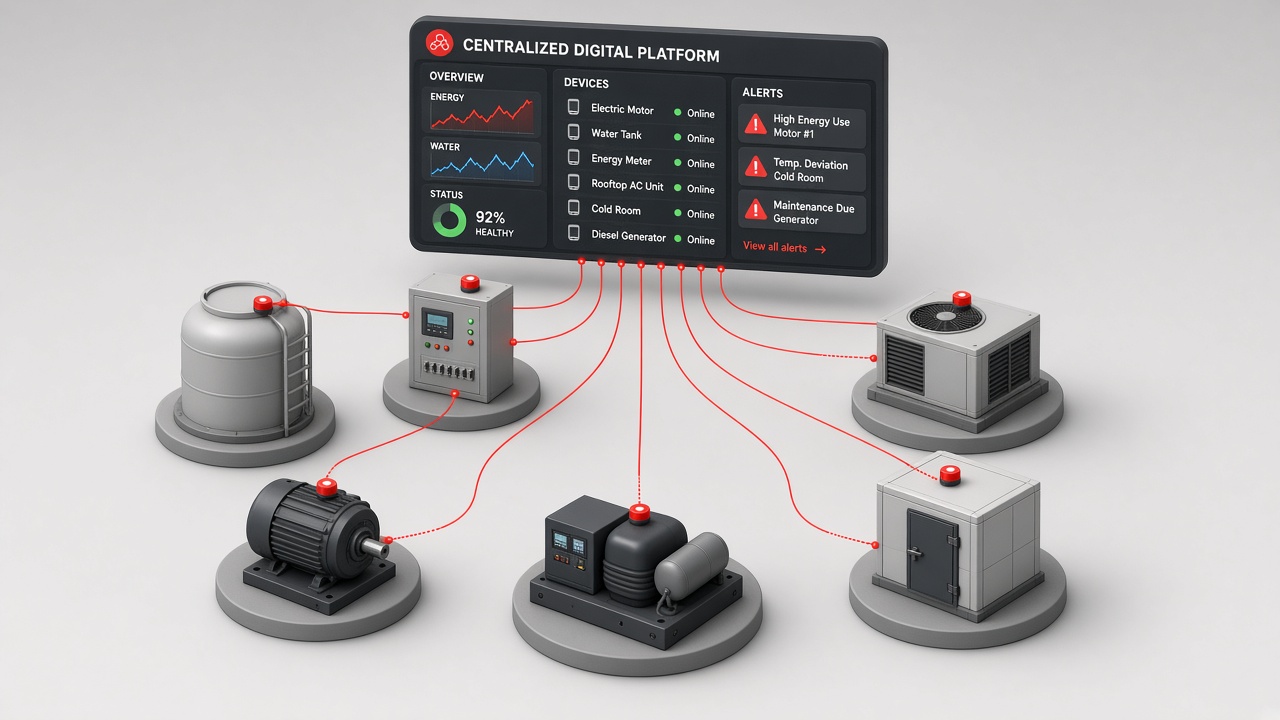
Isometric illustration of a water tank, energy meter panel, motor, generator, air-conditioning unit and cold room, each with a sensor, connected by red lines to a floating centralized digital platform showing energy and water charts, a device list and alerts

Connect Physical Assets to a Centralized Digital Platform

MLT’s IoT solutions connect sensors, devices and physical assets to a centralized digital platform, so that what happens on the ground can be seen, measured and acted on from one place.

The solutions are powered by iSenzoT, MLT’s IoT intelligence platform.

IoT Solutions at a glance
SolutionIoT Solutions
Solution AreaIoT & Smart Infrastructure
ConnectsSensors · Devices · Physical Assets
CapabilitiesSensor Integration · Device Monitoring · Real-Time Data · Dashboards · Alerts · Historical Analysis · Device Health · APIs · Multi-Location
Powered byiSenzoT
GoalOne Centralized View of Physical Operations
Solution highlights
0
Core IoT capabilities
0
Centralized digital platform
iSenzoT
IoT intelligence foundation

How It Works

From the physical asset to the platform
Sensors, Devices & AssetsTemperature, energy, water, air quality, equipment and more
Connectivity & GatewaysReadings transmitted securely
iSenzoT PlatformCentralized device, sensor and data management
Dashboards, Alerts & AnalysisLive views, notifications and history
APIs & Business SystemsIoT data shared where it is needed

Capabilities

Capabilities include:

What IoT solutions include
Sensor IntegrationDifferent sensors, one platform
Device MonitoringStatus of every connected device
Real-Time Data AcquisitionContinuous live readings
IoT DashboardsClear, live operational views
Alerts & NotificationsWhen thresholds are crossed
Historical Data AnalysisTrends and patterns over time
Device Health MonitoringBattery, signal and last seen
API IntegrationConnect with other systems
Multi-Location MonitoringMany sites, one view

Sensor Integration

Temperature, humidity, air quality, water level, energy and door sensors can use different protocols, yet report into one platform with a consistent view of status and readings.
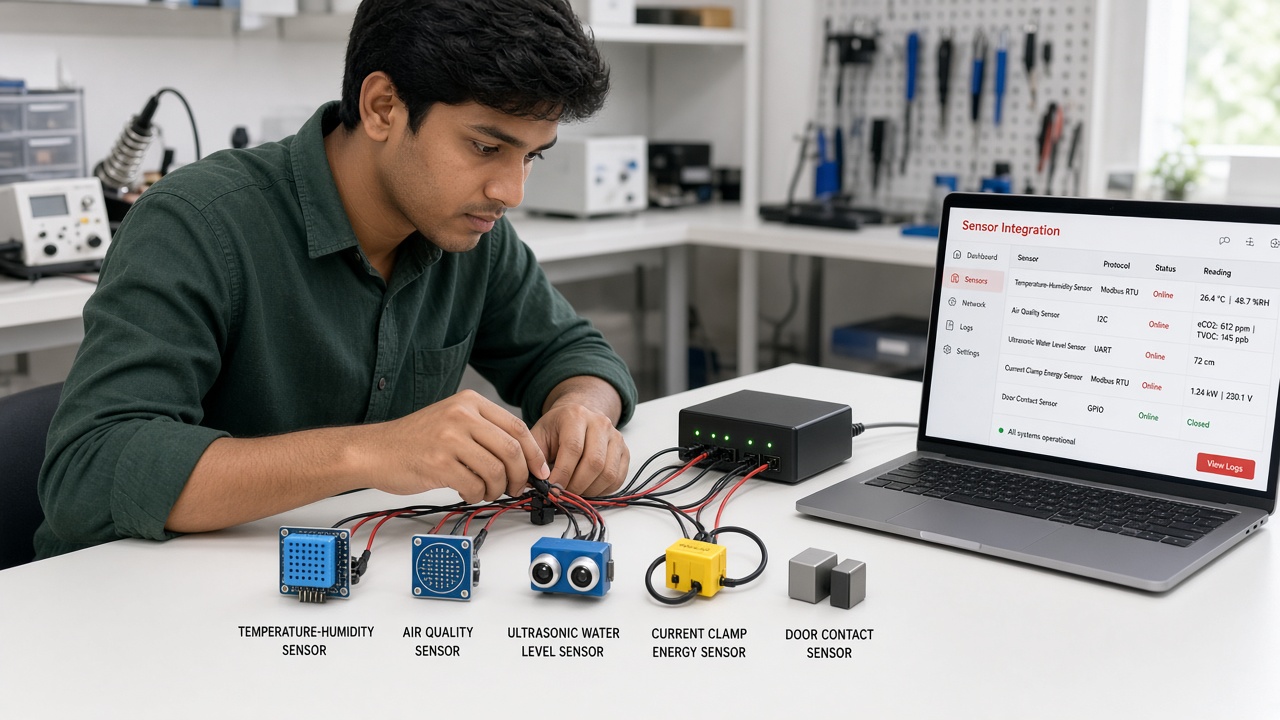
IoT engineer at a lab workbench connecting temperature-humidity, air quality, ultrasonic water level, current clamp energy and door contact sensors to a gateway, with a laptop listing each sensor, its protocol, online status and first reading
Sensor integration: different sensors and protocols brought online in a single platform

Real-Time Data Acquisition & IoT Dashboards

Readings are acquired continuously and presented on dashboards that show what is happening right now, updated within seconds.
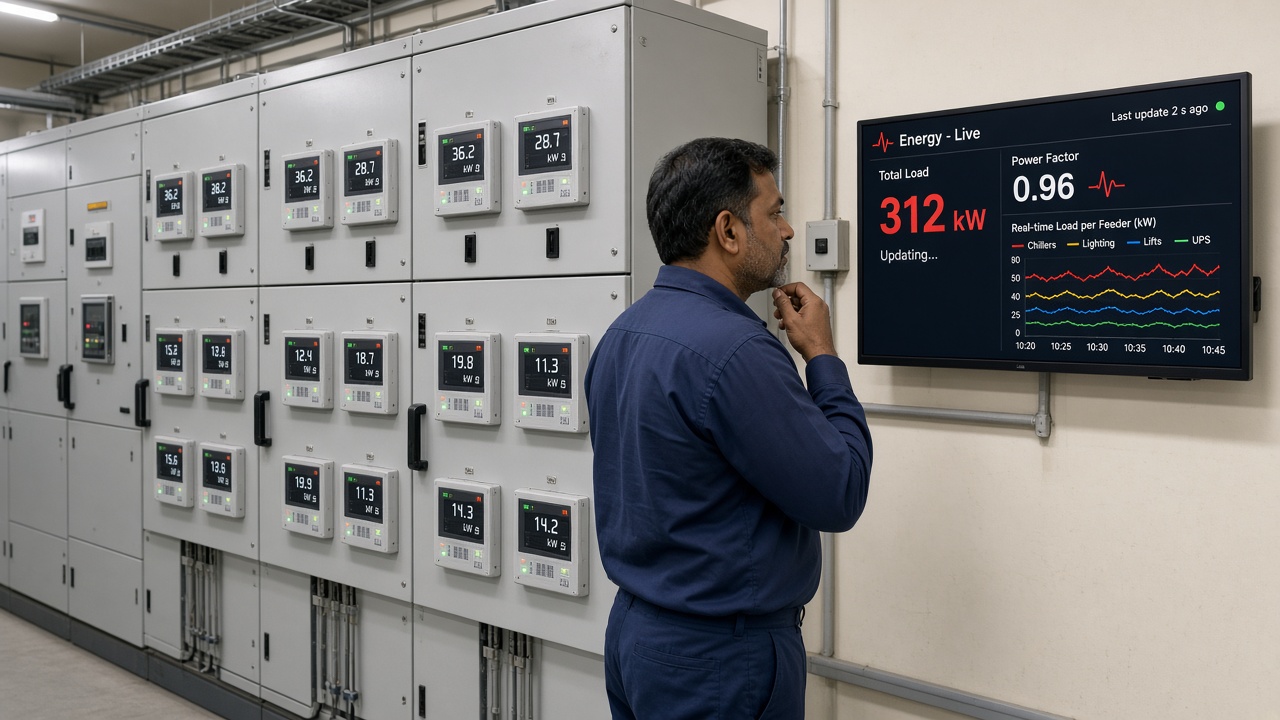
Facility electrician in an electrical panel room with smart energy meters, checking a wall display showing live total load, power factor and real-time load per feeder for chillers, lighting, lifts and UPS
Real-time data: live energy load per feeder from connected meters

Alerts & Notifications

When a reading crosses a defined threshold, the right person is notified on their phone or watch, with the location and what needs checking.
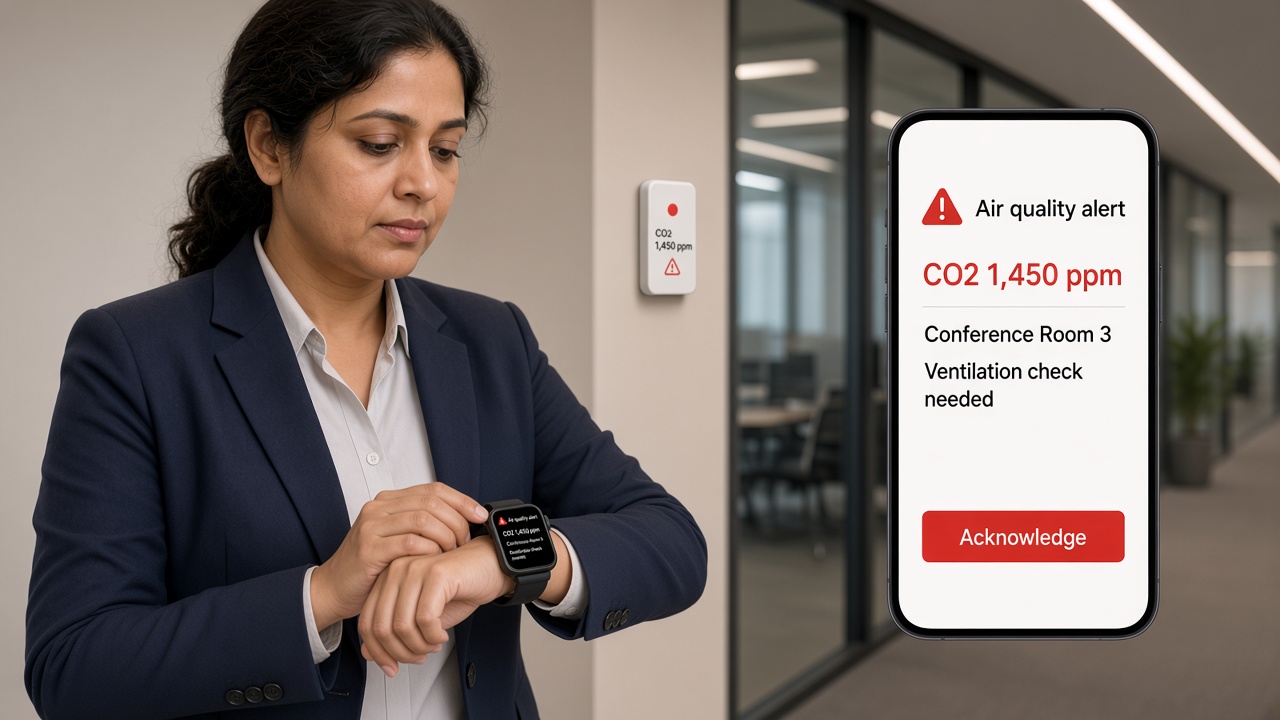
Facility manager in an office corridor checking an air quality alert on her smartwatch, beside a phone screen showing the same high CO2 alert for conference room 3 with a ventilation check needed and an acknowledge button
Alerts: an air quality threshold breach delivered to the facility manager’s watch and phone

Historical Data Analysis

Stored data makes it possible to look back and find patterns, such as recurring temperature rises or changes in consumption from month to month.
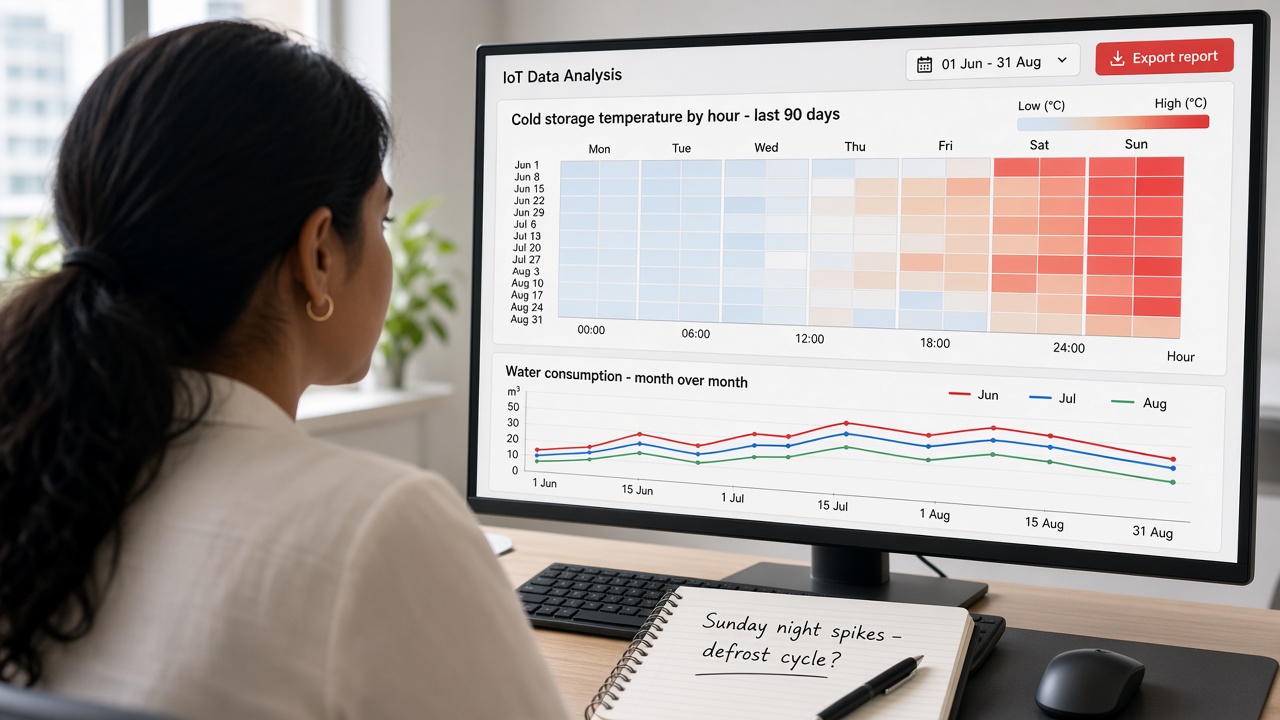
Analyst viewing a 90-day heatmap of cold storage temperature by hour and day with warmer readings at the weekend, a month-over-month water consumption chart and a note questioning a defrost cycle
Historical analysis: a recurring weekend temperature pattern and month-over-month consumption

Device Health Monitoring

The platform tracks the health of the devices themselves, including battery, signal, last-seen time and firmware, so a failing sensor is replaced before data is lost.
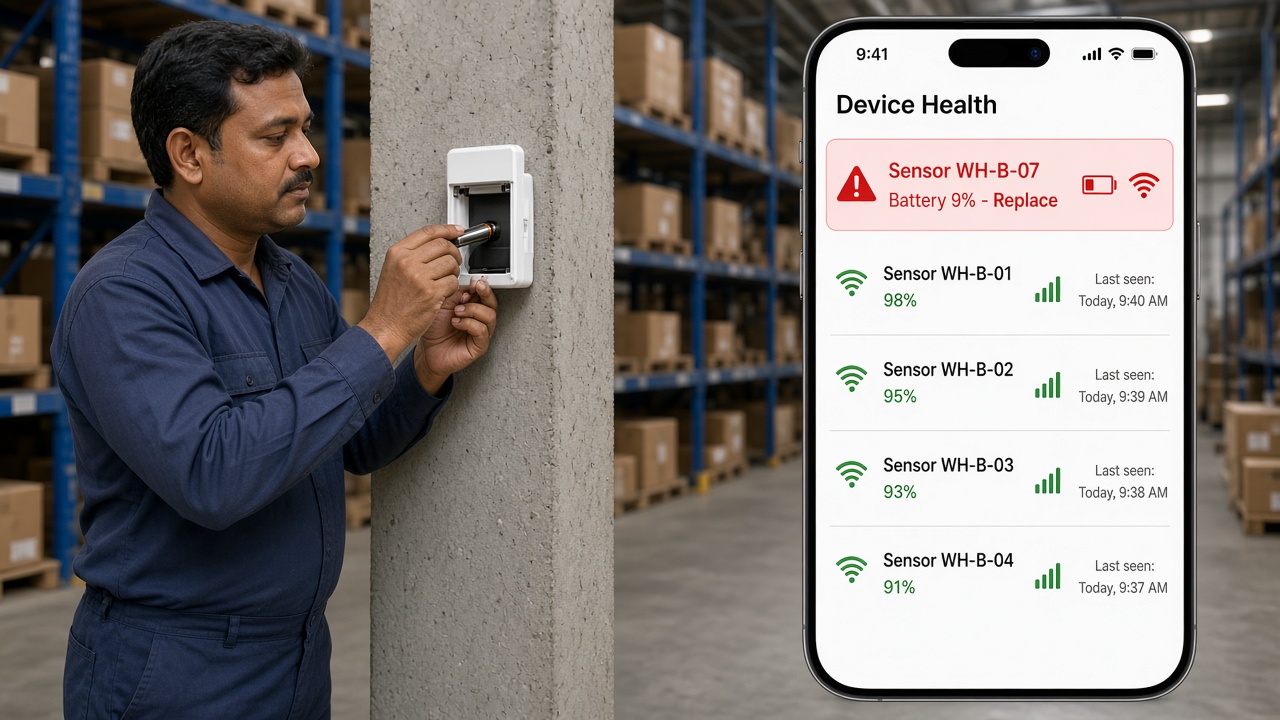
Maintenance technician in a warehouse aisle inserting a fresh battery into an open wireless sensor on a pillar, beside a phone screen showing a device health list with one sensor flagged at 9 percent battery for replacement
Device health: a low-battery sensor flagged and serviced before it goes offline

Multi-Location Monitoring & API Integration

Sites across a region can be monitored from one screen, and APIs share IoT data with business systems such as ERP, maintenance or reporting applications.
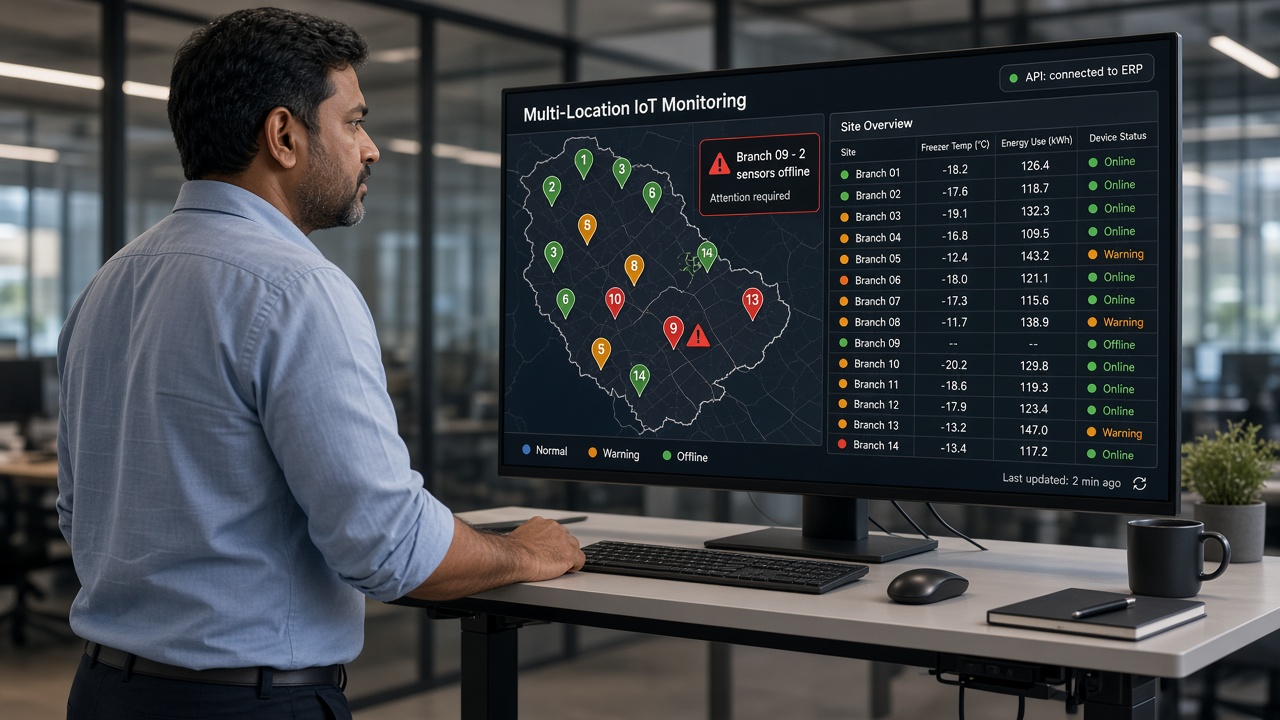
Regional operations head viewing a multi-location IoT monitoring screen with a map of 14 branch pins, a site table of freezer temperature, energy use and device status, a branch flagged with sensors offline and an API connected to ERP badge
Multi-location monitoring: 14 branches on one screen, with IoT data shared to ERP through APIs

Powered by iSenzoT

iSenzoT is MLT’s IoT intelligence platform. It provides the foundation for sensor connectivity, device management, real-time monitoring, alerts, analytics, dashboards, mobile applications and APIs, so each IoT solution builds on a proven base rather than starting from scratch.

Manual checks
  1. Periodic readings taken by hand
  2. Problems found after they happen
  3. Each site checked separately
IoT solutions on iSenzoT
  1. Continuous readings from connected sensors
  2. Alerts as soon as a threshold is crossed
  3. Every site visible from one platform

Explore All IoT & Smart Infrastructure →

One Platform for Every Connected Asset

From sensor integration and real-time dashboards to alerts, device health and multi-location monitoring, MLT’s IoT solutions connect your physical assets to a centralized digital platform, powered by iSenzoT.

Have assets you need to monitor?

Tell us what you want to measure and where, and our team will help design the right sensors, connectivity and dashboards on iSenzoT.

Back to IoT & Smart Infrastructure
Get in touch

Ready to connect your assets?

Share what you want to measure and where, and our team will help design the right sensors, connectivity and dashboards on iSenzoT.

No pitch decks. Just a hello — we’ll take it from there.