

From Sensor Data to Operational Intelligence
IoT deployments generate enormous volumes of data. The real challenge is turning that data into something operations teams can actually monitor, understand and act upon.
For NerasTech, Mountain Lamp Technologies developed a scalable IoT monitoring platform designed to collect, process, visualize and analyse data generated by IoT devices deployed across cold-chain and industrial environments.
The platform brings together device connectivity, real-time data processing, time-series storage, analytics, alerting, dashboards and mobile access into a unified ecosystem.
IoT Data → Processing → Intelligence → Alerts → Action

Project at a Glance
A production-oriented IoT intelligence platform for multi-customer cold-chain and industrial monitoring.
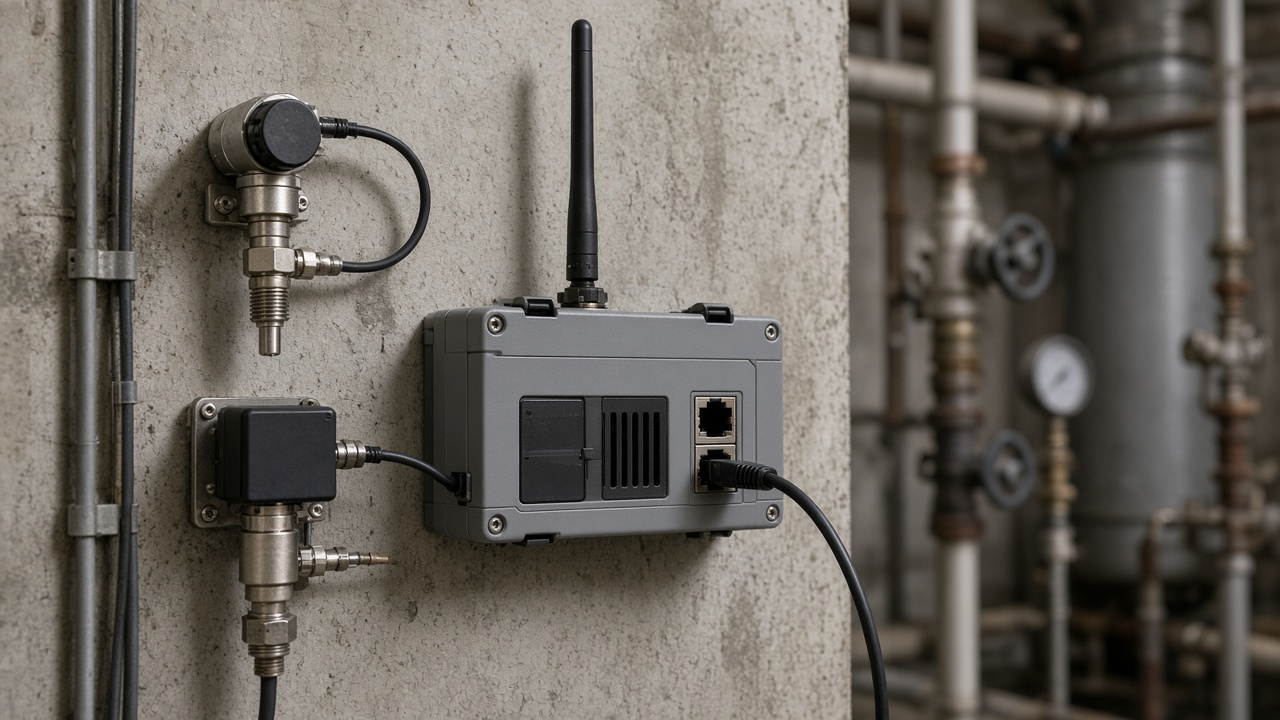
The Challenge: IoT Data Was Growing. The Platform Needed to Grow With It.
As IoT deployments expand across customers and locations, simply receiving sensor data is not enough. NerasTech required a more scalable and production-oriented architecture—modernising the backend data-processing architecture and creating a unified monitoring experience for IoT data.
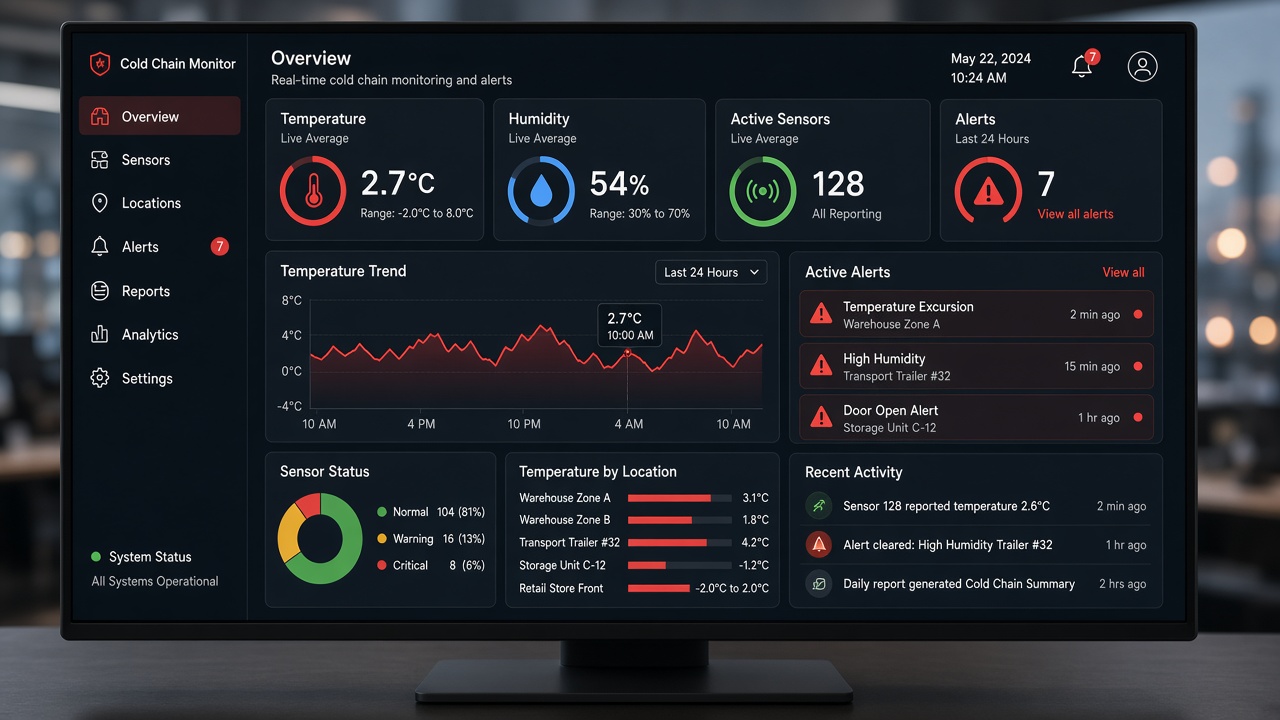
The MLT Approach: Building the Intelligence Layer Around IoT Data
MLT developed a platform architecture that separates data ingestion, processing, storage, APIs and applications. Rather than allowing devices to directly drive application logic, IoT data passes through a structured processing pipeline.
01 — IoT Device Connectivity
The platform receives data from existing IoT devices through MQTT, allowing the solution to work with the existing device ecosystem without requiring firmware changes during the implementation phase.
Why this matters: the platform can evolve independently from the underlying device layer—so the IoT ecosystem can grow without redesigning the entire software architecture for every new device or deployment.
02 — Reliable Data Ingestion
The Data Ingestion Service is the entry point for IoT data. Separating ingestion from downstream processing allows the platform to handle data more reliably and scale processing independently.
03 — Real-Time Data Processing
Once data enters the pipeline, the Real-Time Processing Service converts raw IoT messages into usable platform data—and scheduled jobs support aggregation plus operational functions such as offline-device detection and alert auto-resolution.
04 — Time-Series Intelligence
IoT data is inherently time-based. A temperature, humidity or other sensor value becomes meaningful when viewed against time, location, device, customer, historical trends and operational thresholds.
The platform uses MongoDB Time-Series storage for efficient handling of device readings and aggregated data—including device readings, 5-minute aggregates and 30-minute aggregates—enabling historical analysis without repeatedly scanning raw high-frequency data.
05 — Intelligent Alerts
Don't just show the data—tell someone when something needs attention. The platform includes a rule-based alert engine that shifts IoT from passive monitoring to exception-driven operations.
06 — Centralized Dashboards
Browser-based monitoring covers customers, sites, devices, historical trends, alerts, analytics and device status—with visualization formats including line charts, bar charts, gauges, donut charts and statistical widgets.
07 — Multi-Tenant IoT Architecture
A major architectural capability is multi-tenant design. The hierarchy is Organization → Sites → Devices → Sensors. Each customer operates within its own logical data boundary, with isolation enforced across API, database, dashboard and alert layers.
This allows an IoT platform to support multiple customers without creating a completely separate software platform for every deployment—especially suitable for IoT solution providers managing deployments across multiple end customers.
08 — Web & Mobile Access
IoT intelligence shouldn't remain inside a control room. The platform provides web and mobile access so users can monitor devices and alerts remotely. Push notifications are supported through Firebase Cloud Messaging.
09 — Secure Access
The architecture supports distinct roles—Administrator → Organization Administrator → Organization User—with different levels of access to organizations, devices, dashboards and alerts.
10 — From Device to Decision
The real value of the project lies in the complete data journey—the MLT IoT Intelligence Pipeline.
Technology Architecture
Built as a production-oriented IoT platform with documented separate production infrastructure and CI/CD deployment practices.
Business Impact
- Sensors send data
- Raw readings accumulate
- Hard to scale across customers
- Exceptions found late
- Structured ingestion pipeline
- Real-time + time-series insight
- Multi-tenant isolation
- Alerts → web / mobile action
Conclusion: From IoT Monitoring to IoT Intelligence
The NerasTech project demonstrates an important capability of Mountain Lamp Technologies: we don't stop at connecting sensors. We build the software intelligence layer that sits between devices and the people responsible for the operation.
From MQTT ingestion to real-time processing, from time-series analytics to alerts, and from dashboards to mobile applications, MLT can create the complete software ecosystem required around an IoT deployment.
Connect. Process. Understand. Act.
Mountain Lamp Technologies can help design and deliver the connectivity, processing, time-series analytics, alerting and web/mobile experience your IoT deployments need.