AI, Data & Digital Intelligence · Predictive Analytics

Predictive Analytics: Move From Knowing What Happened to Understanding What May Happen

Predictive analytics uses available historical and current data to identify patterns and estimate likely future outcomes.

Solution Forecasting · Risk Indicators · Anomaly Detection 5 min read
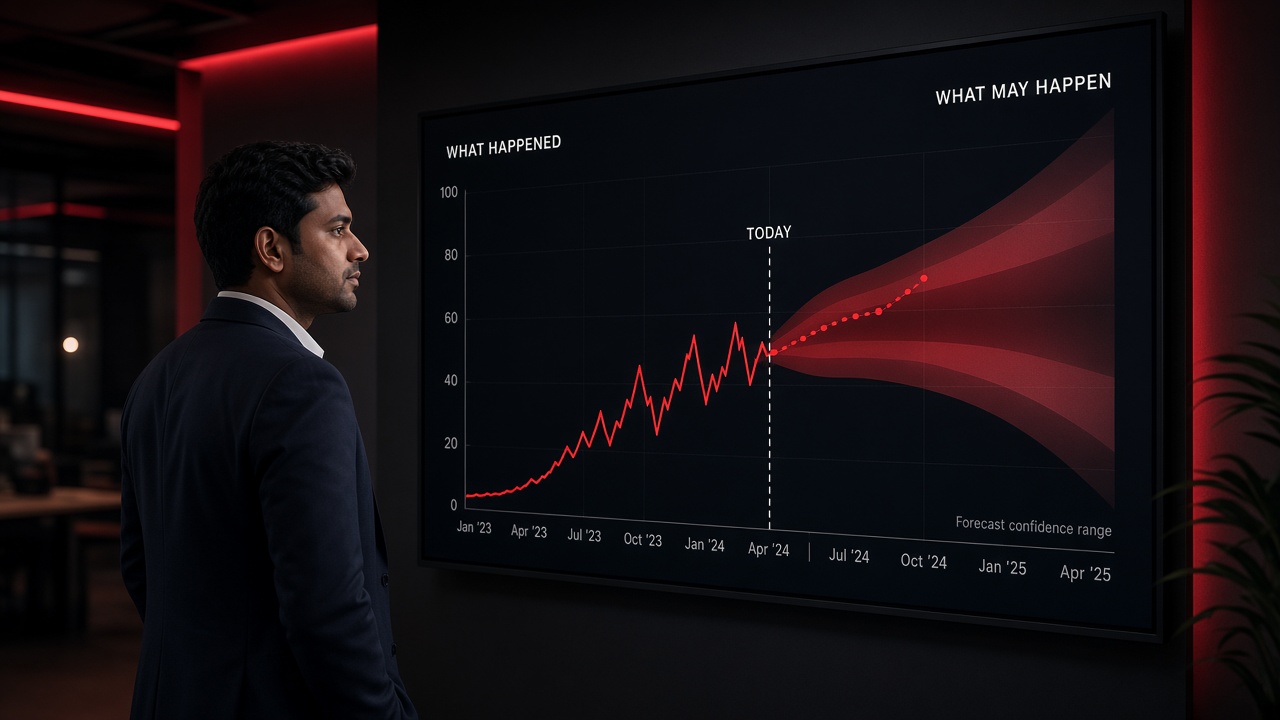
Analyst in front of a wall display showing historical data labelled what happened, a today marker and a forecast line with a widening confidence band labelled what may happen

From What Happened to What May Happen

Traditional analytics explains historical performance.

Predictive analytics uses available historical and current data to identify patterns and estimate likely future outcomes.

MLT can build predictive solutions around suitable datasets and business problems.

Predictive Analytics at a glance
SolutionPredictive Analytics
Solution AreaAI, Data & Digital Intelligence
UsesHistorical & Current Data
MethodsMachine Learning · Statistical Models
OutputsPredictions · Risk Indicators · Forecasts
GoalEarlier, Better-Informed Business Action
Solution highlights
0
Workflow stages
0
Example use cases
Data-Led
Built around suitable datasets

Traditional vs Predictive Analytics

Traditional analytics
  1. Explains historical performance
  2. Answers “what happened?”
  3. Supports reaction after the fact
Predictive analytics
  1. Identifies patterns in historical and current data
  2. Estimates “what may happen?”
  3. Supports earlier, planned action

Typical Workflow
From historical data to business action
Historical DataRecords of what has happened
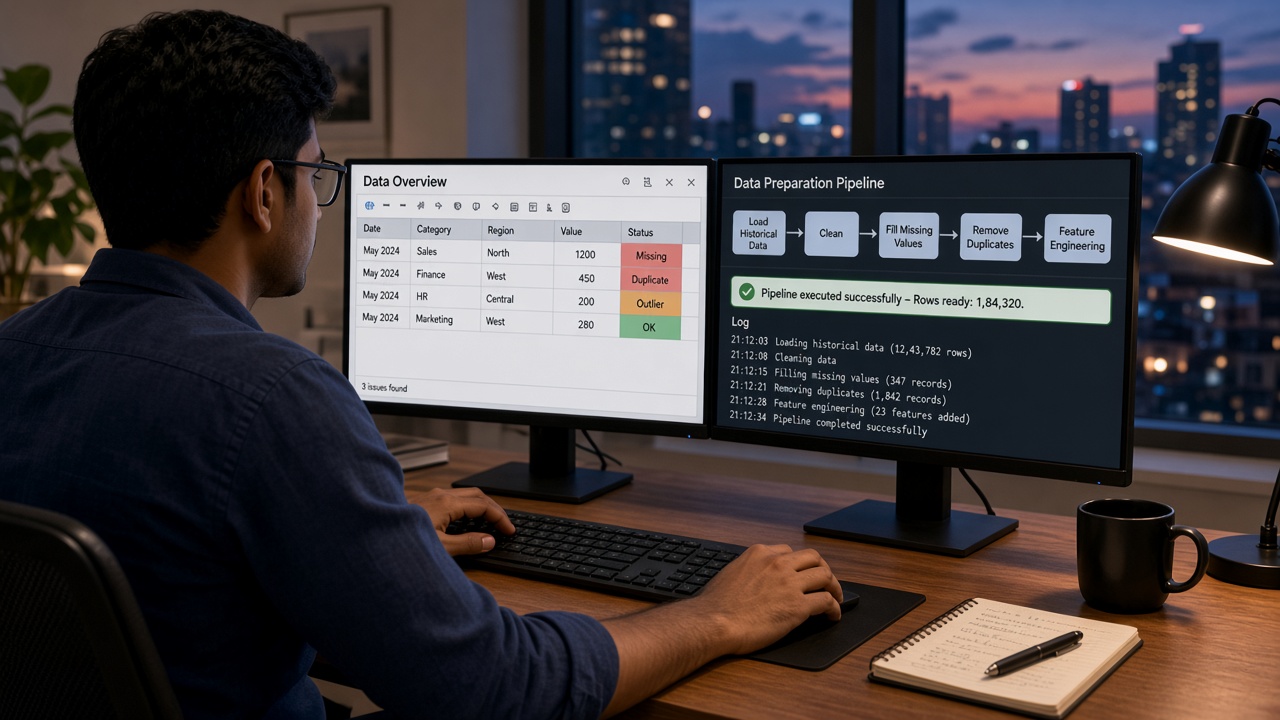
Data PreparationCleaning, combining and structuring
Pattern IdentificationTrends, seasonality and relationships
Machine Learning / Statistical ModelLearns from the patterns
Prediction / Risk IndicatorA likely outcome or level of risk
Business ActionPlan, prevent or respond earlier
Over-the-shoulder view of a data engineer at two monitors: a data table with missing, duplicate and outlier values flagged, and a data preparation pipeline from loading historical data to cleaning, filling missing values, removing duplicates and feature engineering with a run log
Data preparation: historical data is cleaned and structured before any model is built

Example Use Cases

Examples could include:

Where prediction can help
Demand ForecastingExpected demand by period & region
Risk IdentificationEarly signals of elevated risk
Anomaly DetectionUnusual values & behaviour
Equipment-Related PredictionCondition & failure likelihood
Operational ForecastingVolumes, loads & workloads ahead
Customer Behaviour PatternsSegments, trends & churn signals
Resource PlanningStaff, stock & capacity

Demand Forecasting

Sales and order history, combined with seasonal patterns, can help estimate upcoming demand and plan stock by region before a peak arrives.
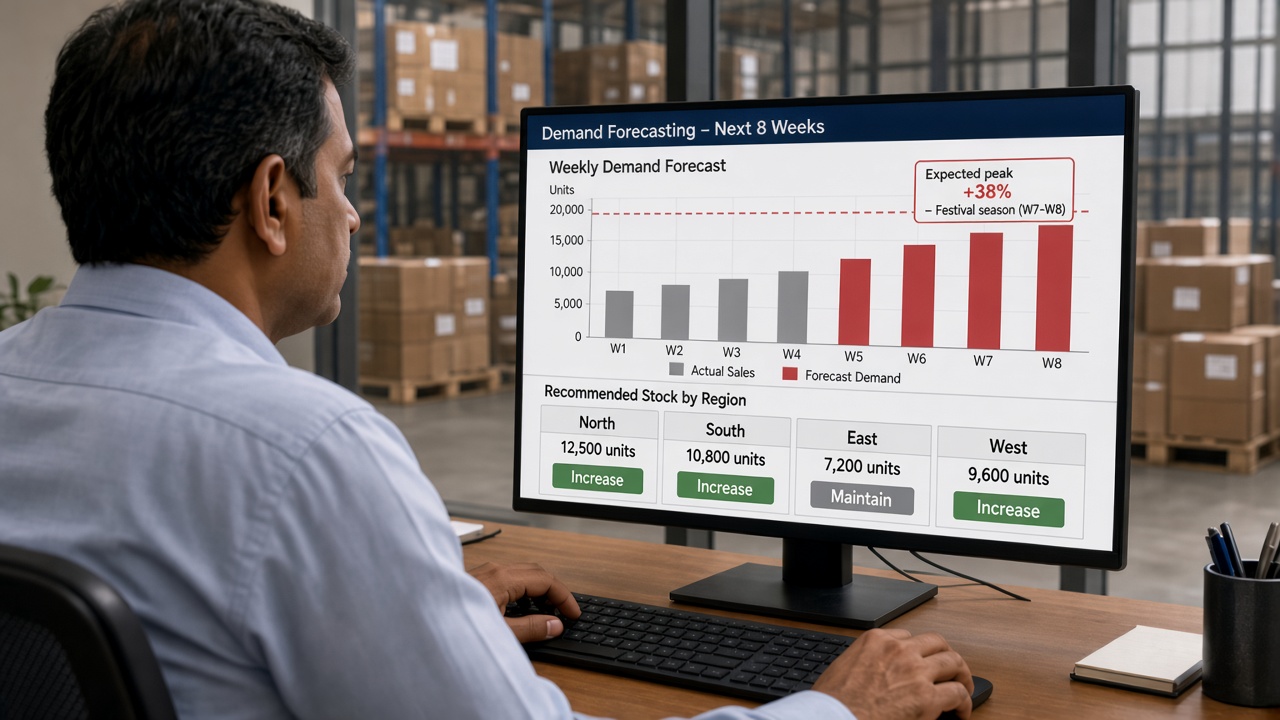
Over-the-shoulder view of a supply planner in a distribution centre office viewing an 8-week demand forecast with actual sales and forecast bars, an expected +38% festival season peak and recommended stock cards for North, South, East and West
Demand forecasting: expected demand and recommended stock ahead of a seasonal peak

Anomaly Detection

Models that learn what “normal” looks like can flag unusual readings or behaviour, such as an unexpected spike in power consumption, so teams can investigate early.

Operators in a pumping facility control room looking at a 24-hour power consumption chart with an expected band and a red spike flagged as an anomaly at Pump House 3, beside an active alerts list
Anomaly detection: a reading outside the expected range flagged for investigation

Operational Forecasting & Resource Planning

Forecasts of incoming volume or workload can help organizations plan staff, capacity and resources before pressure builds.
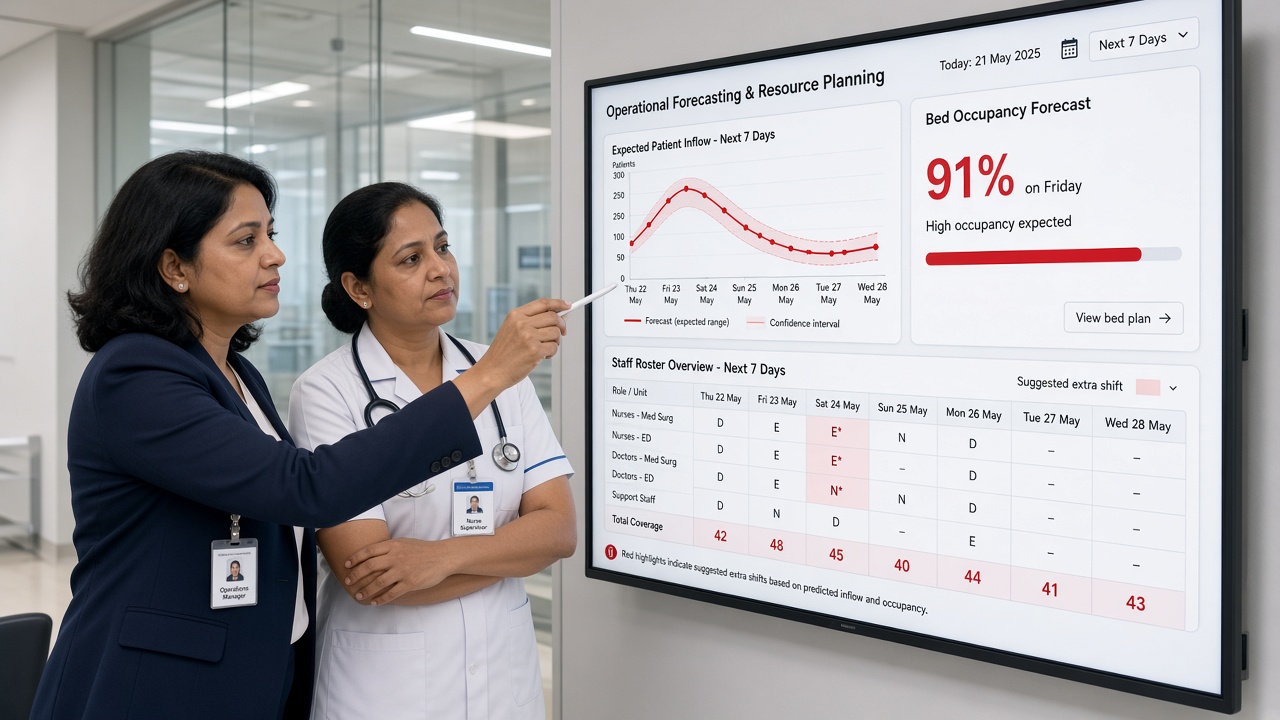
Hospital operations manager and nurse supervisor reviewing a touchscreen with an expected patient inflow forecast for the next seven days, a bed occupancy forecast and a staff roster with suggested extra shifts
Operational forecasting: expected inflow and occupancy used to plan extra shifts

Customer Behaviour Patterns & Risk Identification

Patterns in purchases, visits and interactions can help identify customer segments and early risk signals, so teams can respond before a customer is lost.
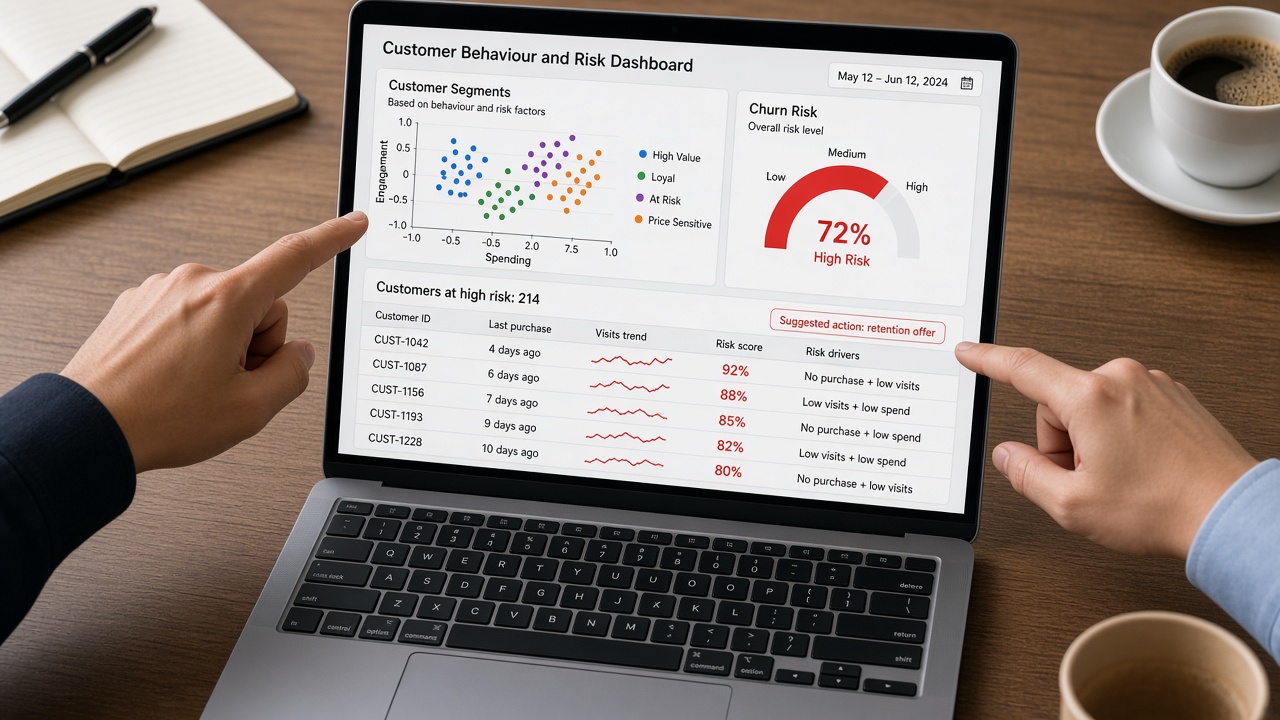
Laptop showing a customer behaviour and risk dashboard with customer segment clusters, a churn risk gauge and a list of high-risk customers with risk scores, risk drivers and a suggested retention action
Customer behaviour patterns: segments and risk scores that point to a suggested action

Predictions Depend on the Data

The actual prediction capability depends on the quality, volume and relevance of the available data. That is why MLT assesses the data first, before committing to what a model can deliver.
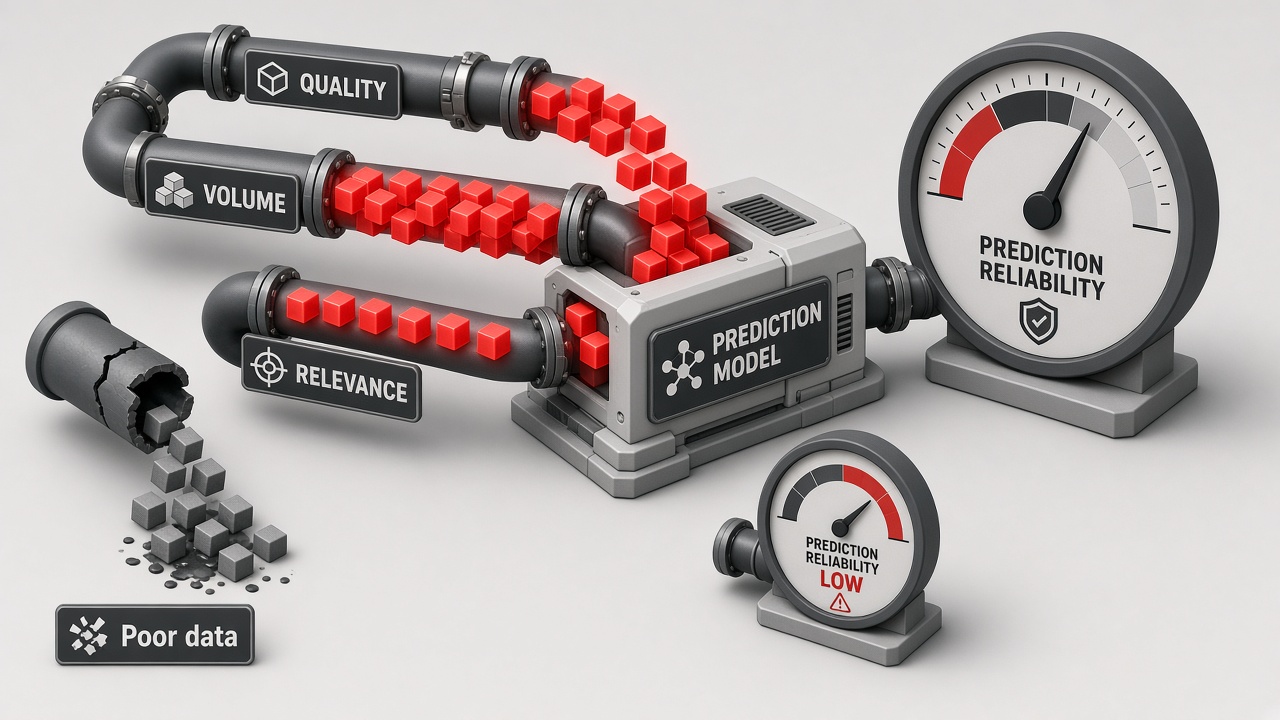
What determines prediction capability
QualityAccurate, consistent and complete records
VolumeEnough history to reveal real patterns
RelevanceData connected to the outcome being predicted
Isometric illustration of quality, volume and relevance data pipes feeding a prediction model that drives a high prediction reliability gauge, while a broken pipe of poor data leads to a low reliability gauge
Quality, volume and relevance of data determine how reliable a prediction can be

Explore All AI, Data & Digital Intelligence →

Act Earlier With Better Foresight

From demand forecasting and anomaly detection to customer patterns and resource planning, MLT builds predictive solutions around suitable datasets and real business problems, so predictions lead to action.

What would you like to predict?

Tell us the outcome you want to anticipate and the data you have, and our team will help assess what a predictive solution can realistically deliver.

Back to AI, Data & Digital Intelligence
Get in touch

What would you like to predict?

Share the outcome you want to anticipate and the data you have, and our team will help assess what a predictive solution can realistically deliver.

No pitch decks. Just a hello — we’ll take it from there.