Outcome · Improve Visibility

One View of Your Cameras, Sensors and Operations

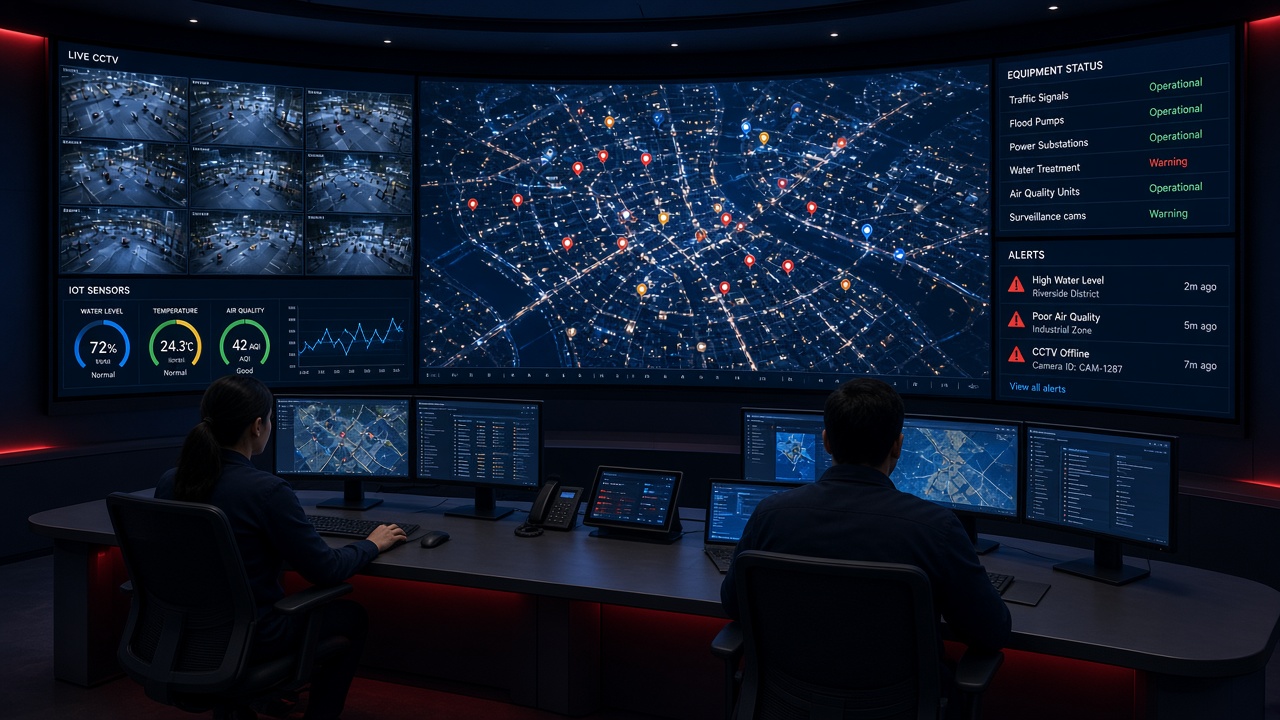
MLT brings video, IoT, applications, data and alerts together into a more centralized view, so teams stop switching between disconnected systems to understand what is happening.

Visibility Outcome DhurgAI · TruSight · iSenzoT · H2O360 6 min read
Integrated command centre video wall combining a city map, live CCTV, IoT sensor gauges, equipment status and alerts

One View of Your Cameras, Sensors and Operations

Organizations often have information distributed across CCTV systems, IoT sensors, business applications, multiple locations, operational teams, different databases and standalone dashboards.

The result can be fragmented operational visibility. Mountain Lamp Technologies brings different technology layers together to create a more centralized view of operations.

Visibility at a glance
OutcomeImprove Visibility
ApproachConnect Technology Layers into One View
PlatformsDhurgAI · TruSight · iSenzoT · H2O360
Connected LayersVideo · IoT · Applications · Data · Alerts
Operating ModelConnect → Centralize → Understand
ScaleSingle Sites to Multi-Location Deployments
ResultCentralized Operational Intelligence
Visibility highlights
0
Connected technology layers
0
MLT platforms
0
Sectors where it matters
1
Centralized view
Multi
Location monitoring
Live
Operational data

The Challenge: Fragmented Visibility

When every system has its own screen, login and data format, understanding what is happening across operations means switching between tools and piecing information together manually.
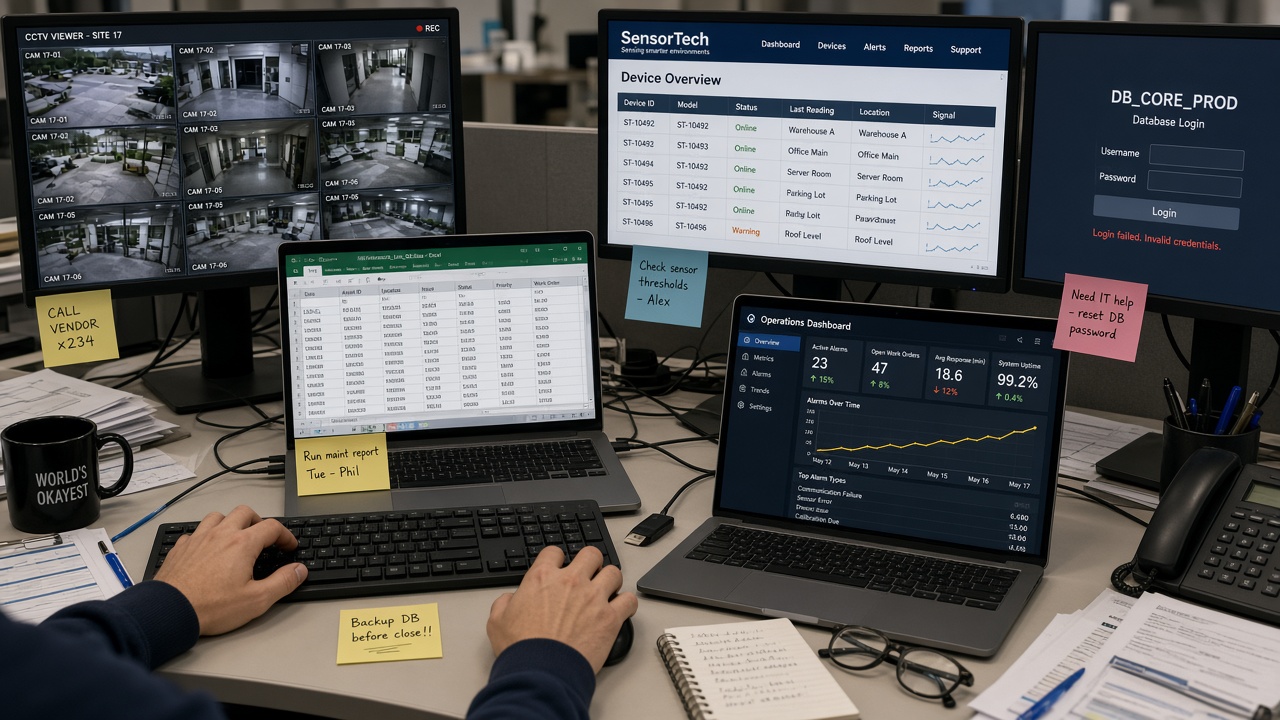
Operator desk with separate monitors for CCTV, spreadsheets, a sensor portal, a database login and a standalone dashboard
Fragmented visibility: separate screens, logins and data for every system
Where information typically sits
CCTV systemsSeparate video viewers
IoT sensorsVendor-specific portals
Business applicationsERP, CRM & work systems
Multiple locationsDistributed sites
Operational teamsKnowledge in silos
Different databasesInconsistent formats
Standalone dashboardsOne view per system

What Can Be Connected

MLT connects five technology layers so information can be viewed and understood together.

Connected technology layers
VideoCameras, VMS and AI events
IoTSensors, devices and infrastructure
ApplicationsBusiness and enterprise systems
DataOperational and historical information
AlertsEvents requiring attention

The MLT Visibility Model

Field inputs are connected, processed by MLT platforms and presented in a centralized dashboard that supports operational intelligence.
From field inputs to operational intelligence
1
InputsCameras, sensors & apps
2
ConnectivityNetworks & integrations
3
MLT PlatformsProcess & analyse
4
DashboardCentralized view
5
IntelligenceOperational insight
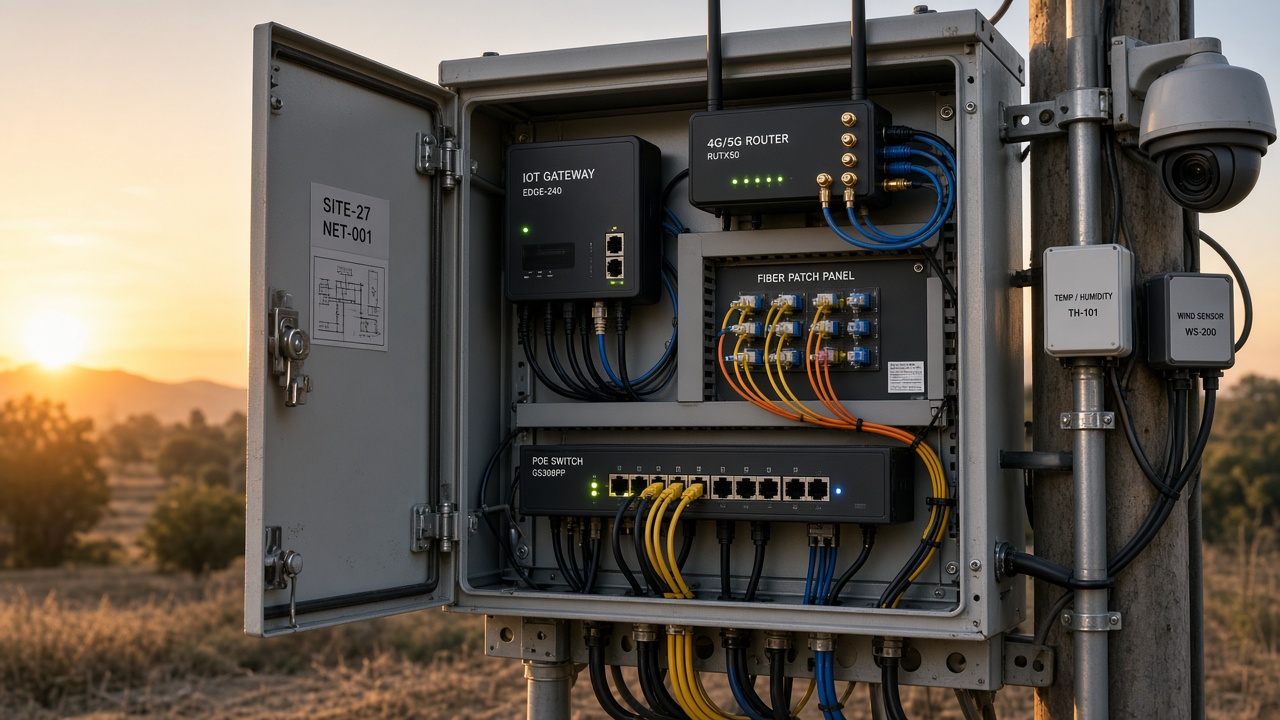
Field network cabinet with IoT gateway, 4G/5G router, fiber patch panel and PoE switch connected to a camera and sensors
Connectivity: gateways, routers and switches link field devices to MLT platforms
Before — Fragmented systems
  1. Separate screens for each system
  2. Multiple logins & data formats
  3. Sites monitored individually
  4. Information pieced together manually
After — Connected operations
  1. Video, IoT, apps & data connected
  2. Processed by MLT platforms
  3. One centralized dashboard
  4. Multi-location status at a glance
  5. Alerts in operational context

Example: Smart Infrastructure Project

A smart infrastructure project may span many locations, each with its own sensors and equipment. Here is how it comes together in one view.
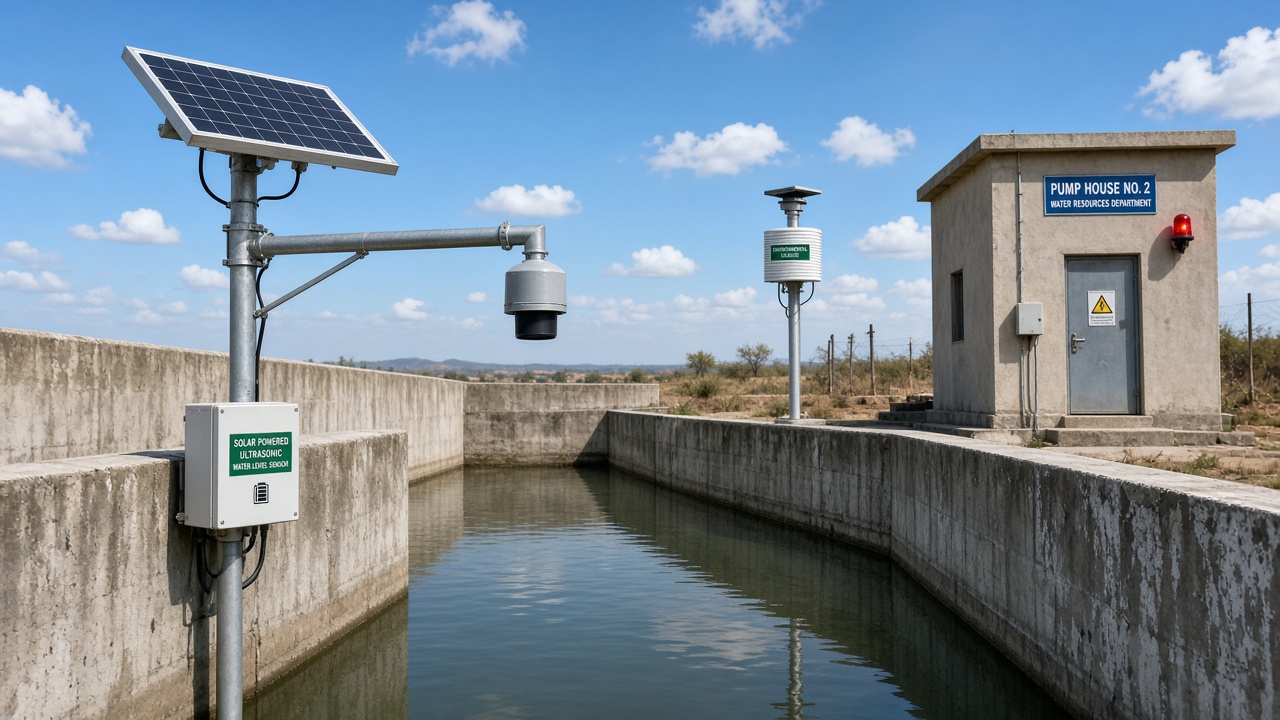
Solar-powered water-level sensor over a reservoir with an environmental sensor and pump house
Field site: water-level and environmental sensors with equipment status
Smart infrastructure flow
Multiple locationsDistributed infrastructure sites
Water-level sensorsTanks, reservoirs & channels
Environmental sensorsSite conditions
Equipment statusPumps, valves & power
Network connectivityCellular, fiber & gateways
iSenzoTIoT data collection & rules
H2O360Smart water infrastructure platform
Centralized monitoringOne view across every site

This provides users with a unified view rather than requiring them to access individual systems separately.
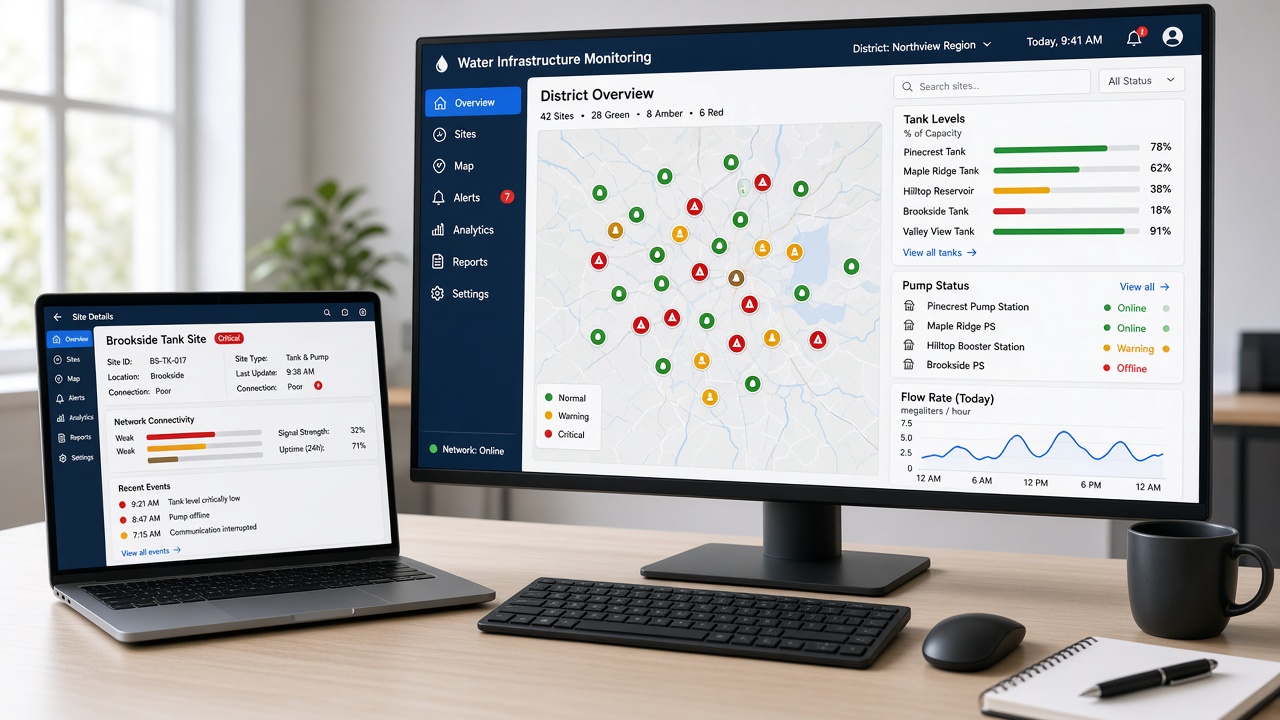
Water infrastructure dashboard with a district map of sites, tank levels, pump status, flow rate and connectivity
Centralized monitoring: site status, tank levels, pumps and connectivity in one dashboard

Where This Matters

Centralized visibility is most valuable where operations are distributed across locations, systems and teams.

Where it applies
Smart CitiesCity-wide operations
Government InfrastructurePublic assets & facilities
Traffic ManagementJunctions & corridors
Water InfrastructureTanks, pumps & networks
ManufacturingPlants & production
LogisticsHubs, yards & fleets
HealthcareFacilities & equipment
Enterprise OperationsMulti-site businesses

Smart Cities & Traffic Management

Connect cameras, signals and network nodes across junctions so traffic and city operations teams see conditions citywide from one place.
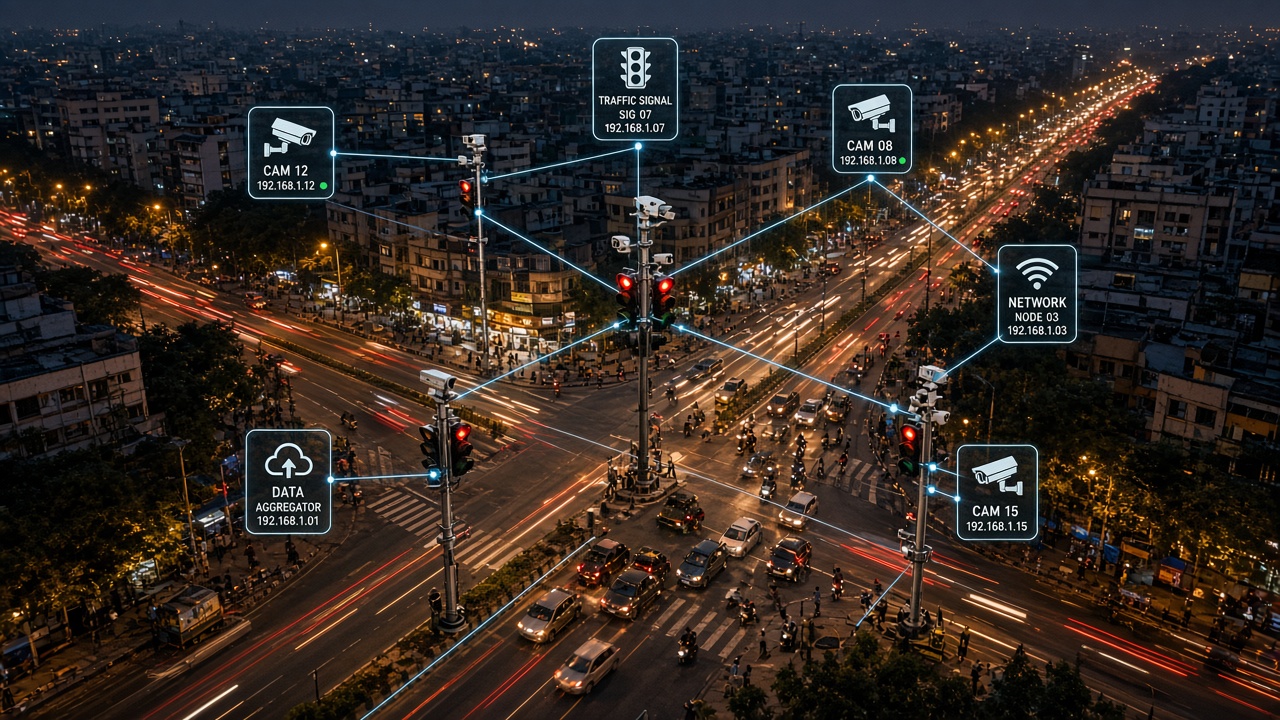
Aerial dusk view of a city junction with connected cameras, traffic signals and network nodes
Smart cities: cameras, signals and network nodes connected across junctions

Enterprise Operations

Review plants, warehouses, hospitals and offices together, with KPIs, camera snapshots and sensor health side by side.
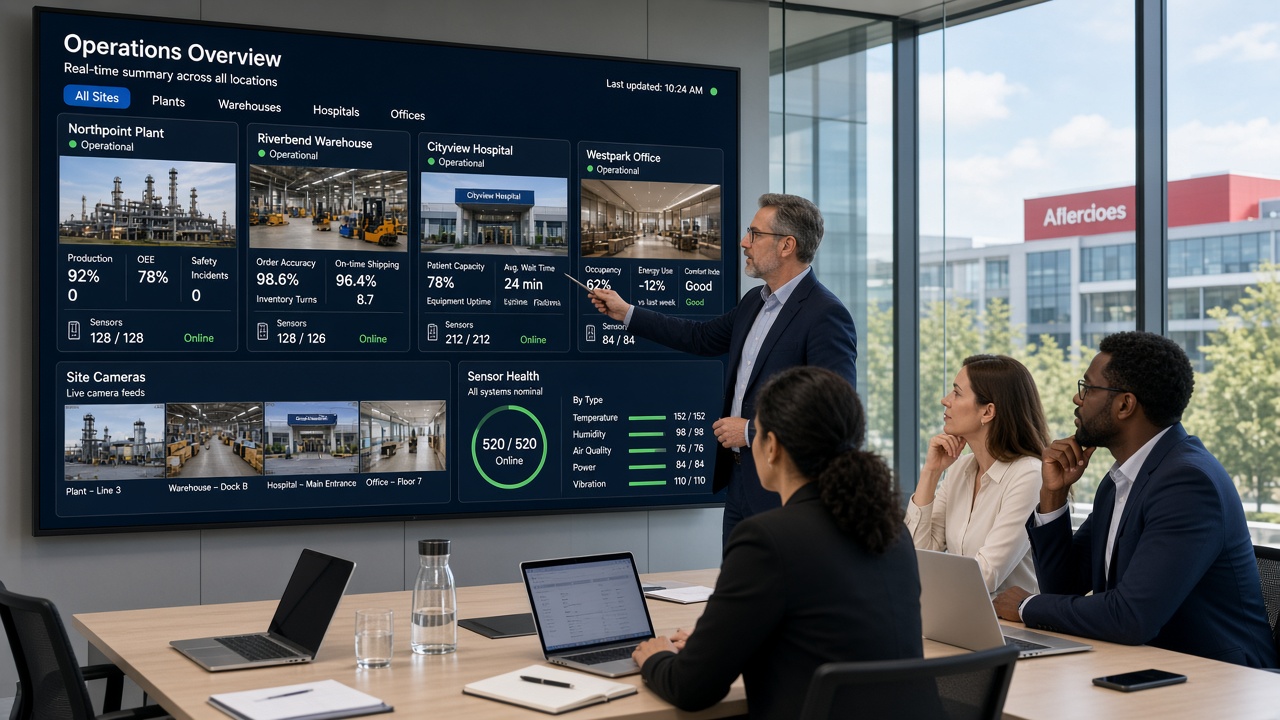
Manager presenting a multi-location operations overview with KPIs, site cameras and sensor health
Enterprise operations: a multi-location overview for leadership reviews

MLT Platforms

Each MLT platform contributes a layer of intelligence to the centralized view.

Platforms behind the outcome
DhurgAIVideo Intelligence
TruSightTraffic Intelligence
iSenzoTIoT Intelligence
H2O360Smart Water Infrastructure

Visibility vs. Control

It is important to distinguish between visibility and control. A centralized dashboard does not automatically mean that an organization has complete control over every connected asset.

The actual visibility depends on device integration, connectivity, permissions and deployment architecture. MLT scopes each deployment around what can be reliably connected, and is clear about what the dashboard shows versus what it can operate.

What determines actual visibility
Device integrationWhat each device exposes
ConnectivityReliable site networks
PermissionsRole-based access
ArchitectureHow the deployment is built

Operations, Seen Clearly

By connecting video, IoT, applications, data and alerts through DhurgAI, TruSight, iSenzoT and H2O360, MLT helps organizations replace fragmented screens with a centralized view of what is happening across their operations.

From Camera. To Intelligence. To Connected Operations.

Planning centralized visibility?

Whether you need to bring cameras, sensors and enterprise systems together for one site or many, the right integrations, connectivity and dashboard design are critical.

Back to all outcomes
Get in touch

Ready to build a connected operations view?

Share a few details about your sites, cameras, sensors and existing systems, and we’ll help design the right centralized visibility approach.

No pitch decks. Just a hello — we’ll take it from there.