IoT & Smart Infrastructure · Smart Infrastructure

Smart Infrastructure: Connect Distributed Infrastructure and Bring Operational Information Into a Centralized Platform

Water networks, utilities, environmental stations, public and industrial infrastructure, and remote equipment, connected and visible from one place instead of many disconnected sites.

Solution Water · Utilities · Environment · Public · Industrial · Remote Assets 5 min read
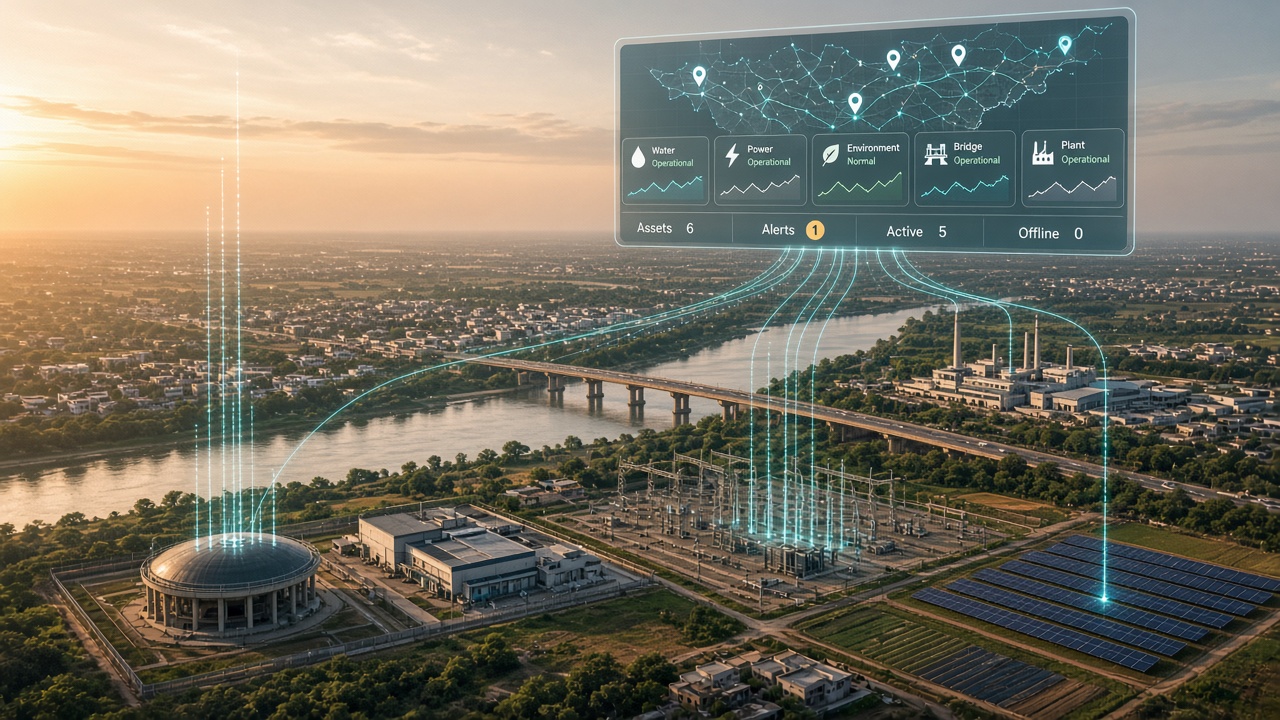
Aerial view of a district at golden hour with a water tank, substation, river bridge, factory and solar farm, each sending data lines up to one floating dashboard with a map and status tiles for water, power, environment, bridge and plant

One Platform for Distributed Infrastructure

Infrastructure is rarely in one place. Tanks, pumping stations, transformers, monitoring stations, bridges, plants and remote equipment are spread across towns, districts and sites, and each is often checked separately.

MLT’s smart infrastructure solutions connect distributed infrastructure and bring operational information into a centralized platform, built on the iSenzoT IoT technology foundation.

Smart Infrastructure at a glance
SolutionSmart Infrastructure
Solution AreaIoT & Smart Infrastructure
ApplicationsWater · Utilities · Environment · Public · Industrial · Distributed & Remote Assets · Infrastructure Health
Suitable ForMunicipalities · Utilities · Government Agencies · Industries · Asset Owners
Technology FoundationiSenzoT
Solution highlights
0
Potential application areas
0
Centralized platform
Distributed
Sites, assets & equipment connected

Potential Applications

Potential applications include:

Application areas
Water InfrastructureTanks, pumps, pipelines & quality
Smart UtilitiesTransformers, feeders & meters
Environmental MonitoringAir, weather & water levels
Public InfrastructureBridges, buildings & civic assets
Industrial InfrastructureCompressors, boilers & utilities
Distributed AssetsMany sites on one map
Remote EquipmentUnattended & hard-to-reach sites
Infrastructure Health MonitoringVibration, tilt, cracks & wear

Water Infrastructure

Tank levels, inflow and outflow, pump status and water quality readings can be tracked from every tank and pumping station without sending staff to each site.
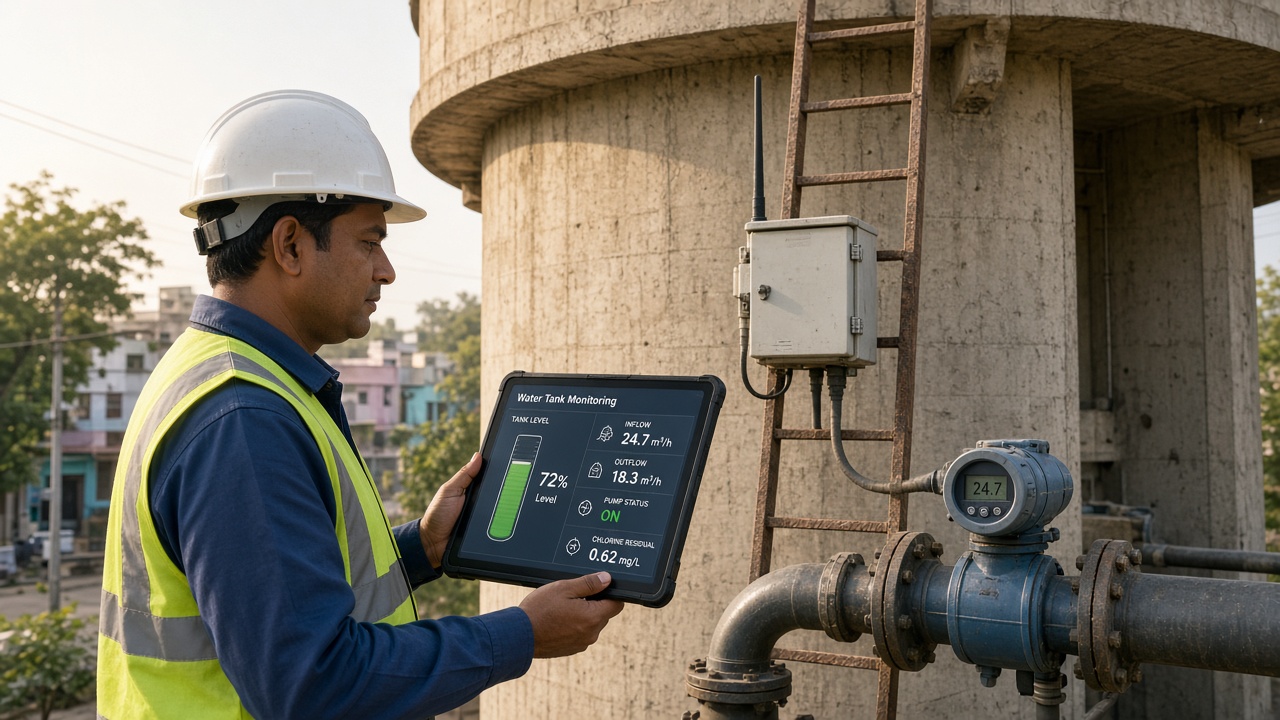
Water engineer at the base of an overhead water tank holding a tablet showing tank level at 72 percent, inflow, outflow, pump status on and chlorine residual, with a sensor enclosure on the tank ladder and a flow meter on the pipe
Water infrastructure: tank level, flow, pump status and chlorine residual from the field

Smart Utilities

Distribution transformers, feeders and meters can report load, temperature and voltage, so overloads are flagged before they turn into outages.
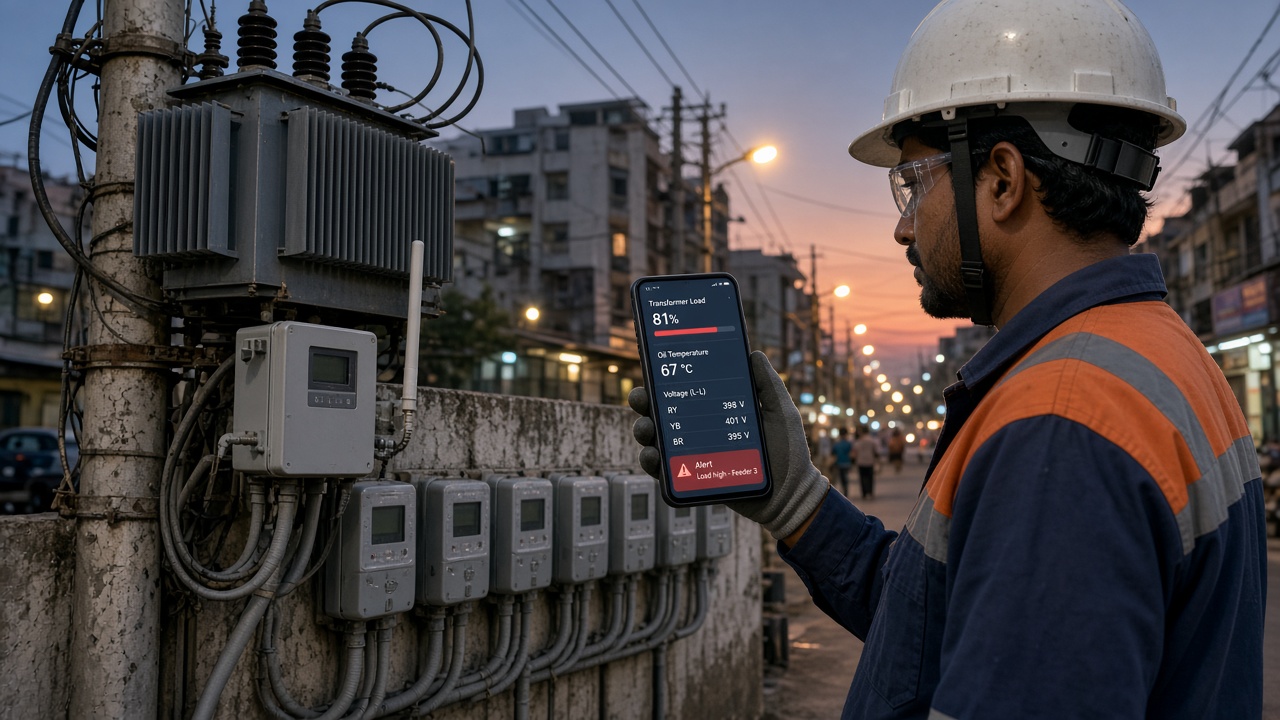
Utility lineman at dusk beside a pole-mounted distribution transformer with a monitoring box and a row of smart meters, holding a phone showing transformer load at 81 percent, oil temperature, phase voltages and a high-load alert for feeder 3
Smart utilities: a transformer running at high load, flagged on the lineman’s phone

Environmental Monitoring

Air quality, rainfall, wind and river level stations can stream readings continuously, supporting pollution tracking and early flood awareness.
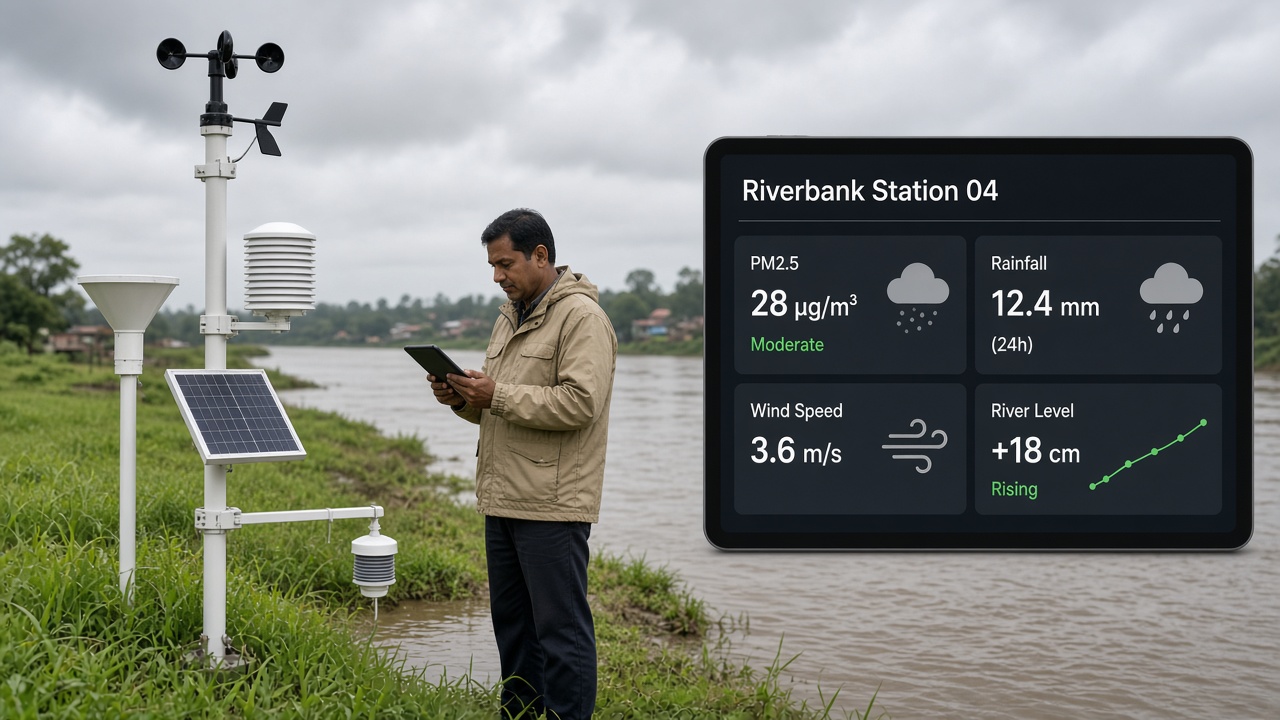
Environmental officer on a riverbank beside a solar-powered monitoring mast with a weather station, air quality sensor and river level sensor, checking his tablet, with a station dashboard showing PM2.5, rainfall, wind speed and a rising river level
Environmental monitoring: air, weather and a rising river level from one solar-powered station

Public Infrastructure & Infrastructure Health Monitoring

Vibration, tilt and crack-width sensors on bridges and civic structures give engineers continuous health data between inspections, so changes are noticed early.
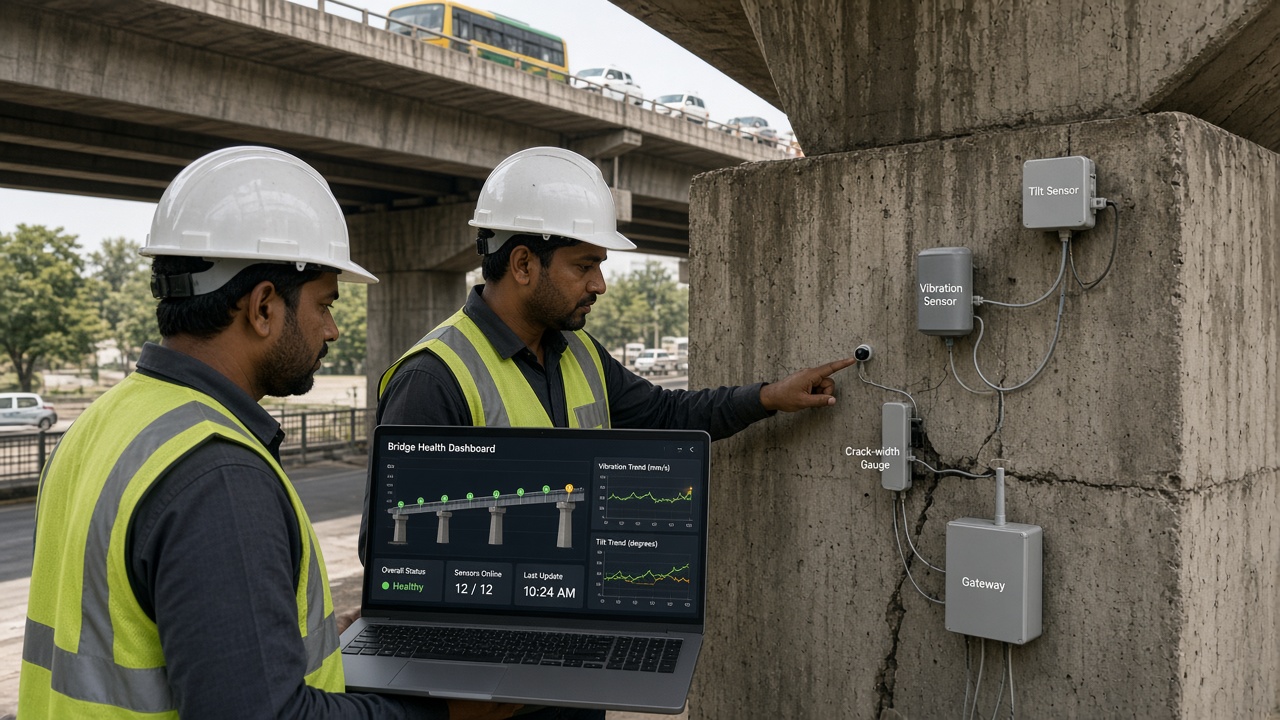
Two structural engineers under a road bridge inspecting a pier fitted with tilt, vibration and crack-width sensors and a gateway, with a laptop showing a bridge health dashboard with sensor points, vibration and tilt trends
Public infrastructure health: bridge pier sensors feeding a live structural health view

Industrial Infrastructure

Compressors, boilers, cooling towers and motors can share pressure, temperature and vibration data, helping maintenance teams act on early warning signs.
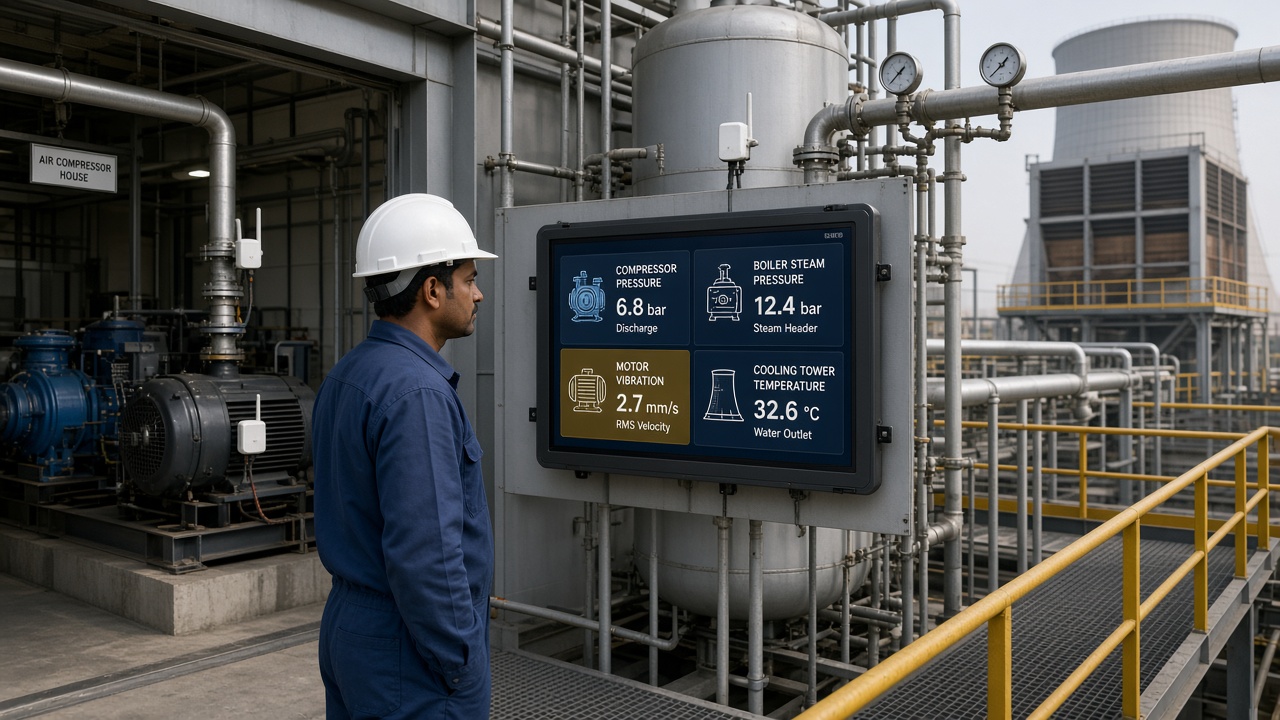
Plant maintenance supervisor in an industrial utility yard looking at a wall touchscreen showing compressor pressure, boiler steam pressure, motor vibration highlighted in amber and cooling tower temperature, with sensors on pipes and motors
Industrial infrastructure: plant utilities on one screen, with motor vibration flagged for attention

Distributed Assets & Remote Equipment

Unattended pumps, cabinets and equipment in remote locations can report status, power and runtime, with every site visible on one map.
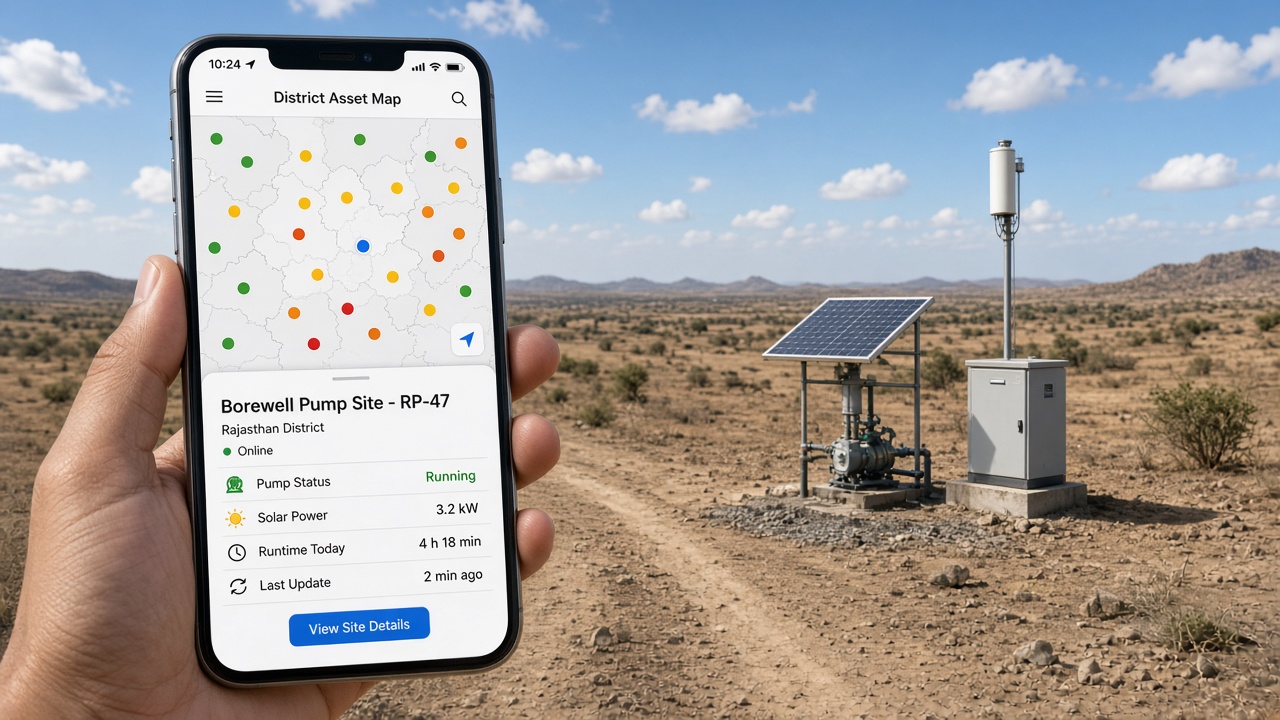
Hand holding a phone showing a district map of scattered asset pins and a site card for a borewell pump with pump running, solar power 3.2 kW, runtime today and last update two minutes ago, with the remote solar pump and equipment cabinet in the background
Distributed assets and remote equipment: a remote solar pump site, visible on a district-wide map

From Scattered Sites to One Operational Picture

The aim is to bring operational information from distributed infrastructure into one centralized platform, rather than relying on site visits, phone calls and separate local systems.

How it comes together
1
Field SensorsOn distributed assets
2
ConnectivityGateways & cellular
3
iSenzoT PlatformCentralized data
4
Operational DashboardMaps, status & trends
5
Alerts & ActionRight team, right site
Disconnected infrastructure
  1. Status known only after site visits
  2. Faults reported late, often by the public
  3. No combined view across locations
Centralized platform
  1. Live status from every connected site
  2. Alerts as soon as conditions change
  3. History and trends across the network

Example: H2O360

H2O360 brings water infrastructure monitoring and intelligence together using the iSenzoT technology foundation.

Tank levels, pump stations, pipelines and water quality are brought into one operational view, helping water teams spot issues such as a possible leak and respond faster.
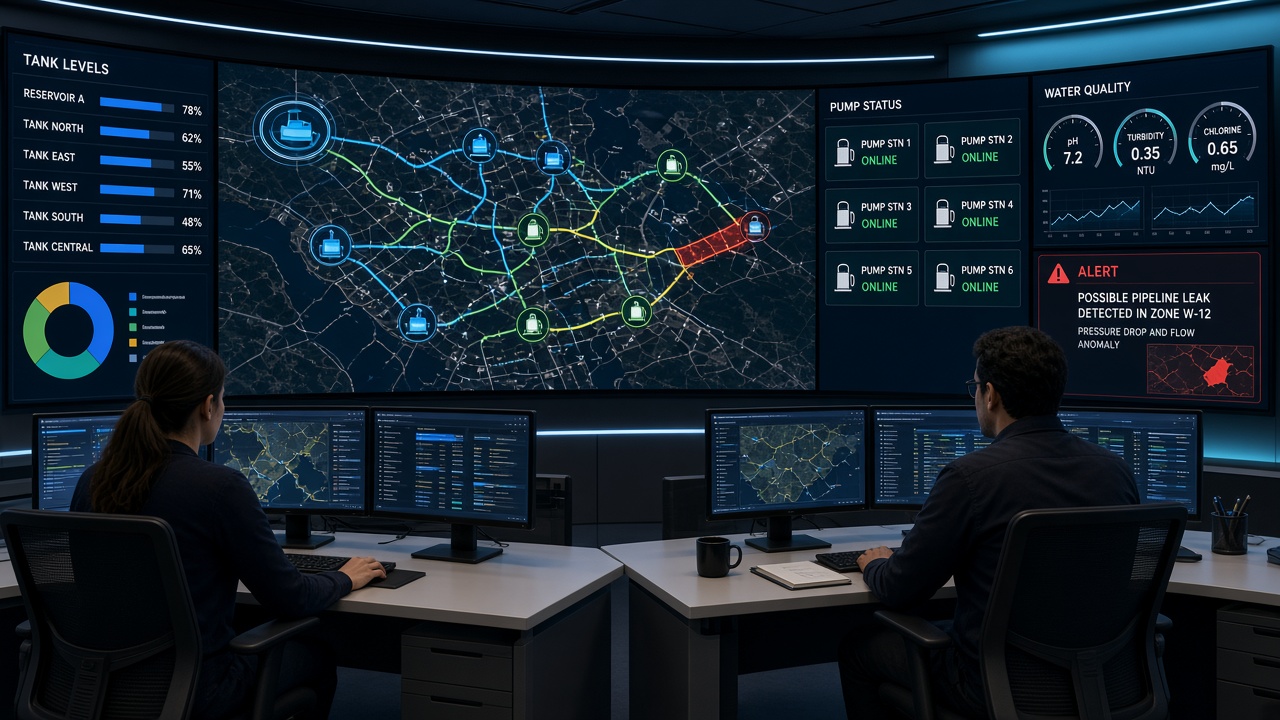
Water utility operations room with two operators in front of a curved video wall showing a city water network map, tank levels, pump station status, water quality gauges for pH, turbidity and chlorine, and an alert for a possible pipeline leak in one zone
Water infrastructure intelligence: tanks, pumps, quality and a possible leak in one operational view

Read the H2O360 Case Study →

Explore All IoT & Smart Infrastructure →

See Your Infrastructure in One Place

From water networks and utilities to environmental stations, public and industrial infrastructure and remote equipment, MLT connects distributed infrastructure and brings its operational information into one centralized platform.

Managing infrastructure spread across many sites?

Tell us about your assets, locations and what you need to monitor, and our team will help design a connected, centralized smart infrastructure platform.

Back to IoT & Smart Infrastructure
Get in touch

Ready to connect your infrastructure?

Share details about your assets, locations and what you need to monitor, and our team will help design a connected, centralized smart infrastructure platform.

No pitch decks. Just a hello — we’ll take it from there.